June 11, 2021
Good morning,
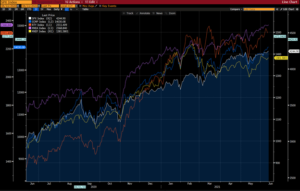
We have spent quite a few pixels lately on the subject of the average bull markets’ second year common characteristics – with increasing volatility and corrections and decreasing trajectories of gain. The current bull market’s first year was above average in just about every dimension including the use of “first time ever” labels – remember. However, its start of the second year (3mo now) has unfolded exactly as scripted. The chart below is the 1yr plot of five global indexes that well represent our global equity market today. If you squint at the right side of the chart (the last three-ish months) you will notice some flattening of their growth rates, and amplitudes of change are up (lines are getting squigglier) reflecting rising volatility. Although hard to see, the S&P 500 index set a new all-time high yesterday. That follows a recent new high on the MXEA (International Developed Markets), a positive confirmation. It would not hurt the bulls’ case if the other three indexes confirmed with new highs of their own soon. Also hard to see on the chart below is another observation about yesterday’s market action. The Russell 2000 (RTY) dropped 1.5% yesterday while the other 4 indexes were up – just another confirmation that this bull is in year 2 – increased volatility.
On Wednesday we noted the recent decline in market momentum and the likely market risk implications of that. However, while the current market outlook includes single-digit correction risk, it still lacks double-digit bear market risk. The risk of more than a single-digit pullback will be limited as long as the stock/bond composite (a risk/return comparison for each asset class) describes an equity-friendly environment. Low interest rates rule the math of that analysis as you would imagine, and the composite is now at an all-time high of 92%. Below 60% and we can start to really worry about bear market risk, at least by this one measure.
Hope you have a great weekend and that I see you Monday 😊
Be well,
Mike