June 24, 2021
Good morning,
Happy Friday! That sentiment rings true for Bulls, and for fully invested Bears, as markets have quickly snapped back from last week’s post-Fed meeting sell-off. So far this week, major U.S. equity indexes are up about 2.5%, twice that for U.S. small caps and half that for international developed and emerging. Jay Powell back-pedaling a little earlier in the week, and the White House making real progress on an infrastructure plan have seemed to help markets the most this week.
Days away from the mid-year mark, most strategists have published their Second Half guesswork. With uncomfortable unanimity, the predictions are for more of the same of the last six months. Even NDR’s expectations for the year’s second half is for more of the same. Their indicators support the prospects for global equities to maintain their uptrends, anticipating continued strengthening of global growth. They are quick to say, as you would expect from a data-driven research organization, that if the evidence changes, so will the expectations.
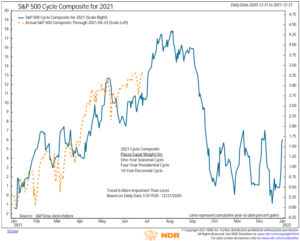
Long term readers have seen the chart below many times. It is a cycles composite chart – a combination of 1, 4, and 10 year cycles (annual, presidential and decennial) expressed ex-ante as one blue line. This chart does not inform investment decisions at all, but if it wasn’t uncanny how often a year tracks the pre-scribed path of the cycles combined, then we wouldn’t be looking at this chart very much. Looking at the chart below, one could say that the strategists may be right … for now.
Have a great weekend.
Be well,
Mike