+31.49%, +18.40%, +28.71% – any guesses as to what these are? They are the last 3 annual total returns of the S&P 500 Index. Compounded in that sequence amounts to a 200% return in 3yrs. It’s hard to find a better 3yr string. Actually, it isn’t that hard, ’97-’99 was a better 3yr string and that period compounded to 207%. That century ending better 3yr string was, however, followed by a 3yr, -38% decline. Does this mean gloom for the next three years for us? Not necessarily.
It is chilling to consider that the 31% return above, in 2019, was followed by the start of one of, and probably will be, the worst pandemics in modern history. This is what the phrase “bloodless verdict of the market” refers to. The market is not without emotion, it actually operates on emotion, but everything it evaluates is in economic terms. The loss of lives due to war, terrorism and disease is without toll to the market. It is not a redeeming reflection of capitalism, but I digress.
Speaking of emotion, it would be hard for any investor to look at the recent record of performance of markets and not expect some kind of reversion to the mean. It’s natural, it’s human, behavioral economists call it a built in bias. However, the best investors stand anchored in the present; what is the clean (no biases) picture today and what does it portend for tomorrow. Fundamentally, valuations are historically high today but, relative to the low current interest rate environment, valuations are less stretched. You have seen the following question before and it is one I ask myself when I’m suffering index-altitude sickness; why shouldn’t the lowest rates in history produce the highest return patterns in history?
Looking ahead: “What is the probability of a recession in the next 12-18 months?” is the starting point of any look forward for a risk manager. Not all bear markets are accompanied by a recession but all recessions are accompanied by bear markets, and typically the worst kind. Looking forward today, the probability of a recession looks very low, it is a non-zero number, but low enough to remove it from the market forecast calculus. Rates remain historically low and investors still see no alternative risk adjusted returns in the public markets that can compete with equities. Earnings growth is still healthy, even if you consider the most conservative forecasts. This is your bull argument – low or no recession probability, TINA (there is no alternative) remains supportive, and solid earnings growth. What’s left is one known and one unknown bearish argument. Of course, there are an infinite number of unknowns out there but let’s relabel it as a known-unknown; Covid. Science is leaning toward endemic status for Covid by year-end, including more variants and deaths. The market can and probably will look through Covid for ’22 if where the science is leaning continues to appear accurate. The known bearish factor ahead is the Fed’s removal of the punch bowl, and if the markets’ (bonds and equities) reaction to the Fed minutes yesterday (1/5) is any indication, the removal of liquidity by the Fed will be the over-riding determinant of near-term market action all year.
How do these bullish and bearish speculations distill out in the coming year? I think it’s hard to expect another 25% gain in the S&P 500 (the average gain of the past 3yrs), given current valuations. However, there appears to be ample support for current prices, and without a recession looming, it seems that a bear market correction (-20% or more) is unlikely as well. The depth and frequency of corrections (drawdowns) normally increase in the third year of a bull market, and I cannot think of any reason that our current 3yr old won’t exhibit the same pattern of increased volatility. All that said, I suspect we’ll see a rangebound market this coming year but with a wide range. Trading inside a +10%/-10% of zero range and settling down at year end with a high single digit return (5%-10%).
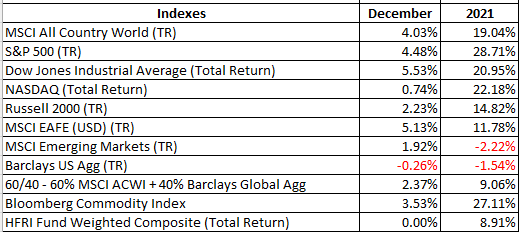
2021 Performance: both the taxable and non-taxable models did well last year and beat their respective benchmarks; the ACWI (All Country World Index) and the Global 60/40. Recall that it is easier to generate alpha (outperformance) with a multi-asset model (TQM-IRA / equities & bonds), than a single asset model (TQM / equities only). TQM exceeded its benchmark by ~200bps, while TQM-IRA returned double its benchmark.
To a Healthy and Happy ’22 for you,
Mike
Sources: Addepar, Bloomberg, NDR
Disclosures
Investment advisory services offered through Robertson Stephens Wealth Management, LLC (“Robertson Stephens”), an SEC-registered investment advisor. Registration does not imply any specific level of skill or training and does not constitute an endorsement of the firm by the Commission. This material is for general informational purposes only and should not be construed as investment, tax or legal advice. It does not constitute a recommendation or offer to buy or sell any security, has not been tailored to the needs of any specific investor, and should not provide the basis for any investment decision. Please consult with your Advisor prior to making any Investment decisions. The information contained herein was carefully compiled from sources believed to be reliable, but Robertson Stephens cannot guarantee its accuracy or completeness. Information, views and opinions are current as of the date of this presentation, are based on the information available at the time, and are subject to change based on market and other conditions. Robertson Stephens assumes no duty to update this information. Unless otherwise noted, any individual opinions presented are those of the author and not necessarily those of Robertson Stephens. Indices are unmanaged and reflect the reinvestment of all income or dividends but do not reflect the deduction of any fees or expenses which would reduce returns. Past performance does not guarantee future results. Forward-looking performance targets or estimates are not guaranteed and may not be achieved. Investing entails risks, including possible loss of principal. Alternative investments are only available to qualified investors and are not suitable for all investors. Alternative investments include risks such as illiquidity, long time horizons, reduced transparency, and significant loss of principal. This material is an investment advisory publication intended for investment advisory clients and prospective clients only. Robertson Stephens only transacts business in states in which it is properly registered or is excluded or exempted from registration. A copy of Robertson Stephens’ current written disclosure brochure filed with the SEC which discusses, among other things, Robertson Stephens’ business practices, services and fees, is available through the SEC’s website at: www.adviserinfo.sec.gov. © 2021 Robertson Stephens Wealth Management, LLC. All rights reserved. Robertson Stephens is a registered trademark of Robertson Stephens Wealth Management, LLC in the United States and elsewhere.