May 4, 2022
Good morning,
It’s finally here – Fed Day. Despite all the anticipation, it’s hard to see much of a surprise on the most basic of decisions – the rate move. Futures are up 50 bps (.5%) early this morning but that just feels like traders anticipating a “buy-the-news” event this afternoon. I wouldn’t be surprised to see Futures fade back to UNCH (unchanged on the day) into the meeting announcement at 2pm EDT – we’ll see. A 50 basis point rate hike by the Fed looks pretty much locked in at this point. The real uncertainty will revolve around QT (Quantitative Tightening) and the Fed Chair’s comments about the future. The big open question is the possibility of a 75 bps hike next month at the June meeting. I’m sure Chair Powell has the answer to that question well scripted in his mind already. He may leave the door open for such a move, it’s hard to see him pre-committing , even if the labor market continues to remain strong (Friday’s numbers). All in all, good theatre but it’s doubtful, I think, that the Q&A today will contain a catalyst to turn the equity market turnaround.
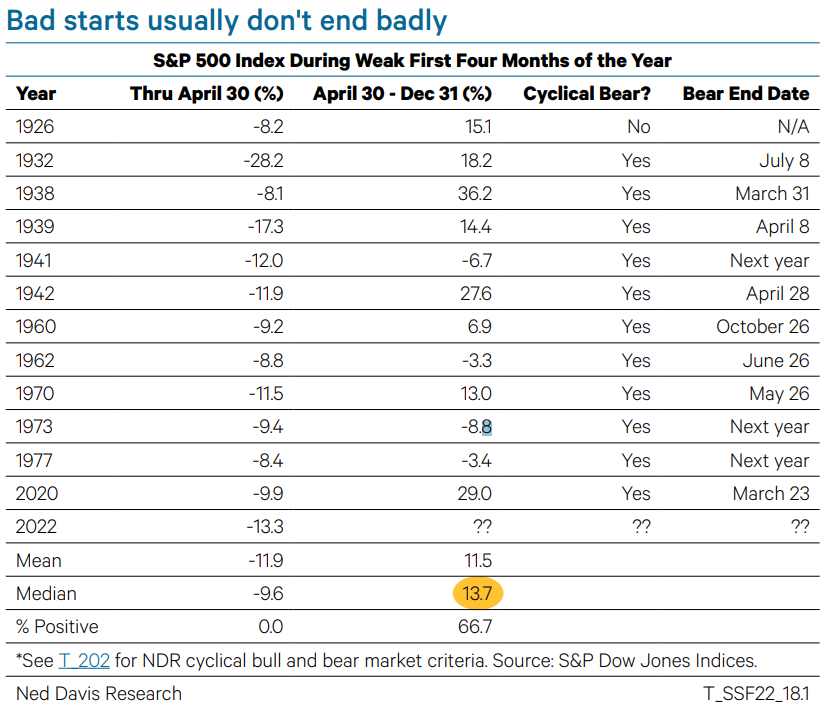
Oversold readings are beginning to get extreme again as they did in February and March before that relief rally. However, there is still room for them to fall further before they would be clanging the rally bell. That dovetails well with the proposition that we probably have more to go in time at least, if not magnitude as well, before we see more constructive behavior from equities. With the S&P 500 Index down 13.3% for the year through April – and that’s about the best performing index of the lot, many stocks are down over 50% – this year is the worst start to a year since 1939. The table below expands the list to years when the S&P 500 fell at least 8% to see what it has meant for the rest of the year. From April 30 through December 31, the S&P 500 rose 66.7% of the time by a median of 13.7%. That also foots with Can’t Wait (til end of summer) narrative of late.
_______________________________________
Oversold readings are beginning to get extreme again as they did in February and March before that relief rally. However, there is still room for them to fall further before they would be clanging the rally bell. That dovetails well with the proposition that we probably have more to go in time at least, if not magnitude as well, before we see more constructive behavior from equities. With the S&P 500 Index down 13.3% for the year through April – and that’s about the best performing index of the lot, many stocks are down over 50% – this year is the worst start to a year since 1939. The table below expands the list to years when the S&P 500 fell at least 8% to see what it has meant for the rest of the year. From April 30 through December 31, the S&P 500 rose 66.7% of the time by a median of 13.7%. That also foots with Can’t Wait (til end of summer) narrative of late.
Be well,
Mike