July 11, 2022
Good morning,
It would not be unreasonable to suggest that the Fed’s tightening cycle to combat unexpectedly high inflation is at the top of the list of reasons for the current bear market. With the caveat that a multitude of factors will determine how the market proceeds from here, the Fed and inflation will likely remain at the top of the list of market drivers in the months ahead.
At the risk of oversimplification, there seems to be three scenarios for inflation and the Fed ahead:
Scenario 1: inflation runs persistently high in the coming months. The Fed would likely feel compelled to continues the aggressive tightening cycle, +75bps hikes for the next meeting at least and a minimum of +50bps for the next several meetings. Financial conditions would tighten quickly, increasing the likelihood that the economy falls into a recession in 2022. Bear markets that overlap with recessions decline 34.6% over 15.3 months, on average. The implication would be that the stock market could drop another 10% or more in the second half as is common in recession bears.
Scenario 2: inflation cools quicker than expected, allowing the Fed to slow the pace of interest rate hikes in the second half of the year. However, the damage is already done to the economy, and it eventually slips into a recession. Given the strength of the labor market currently, a Fed pivot could delay the start of the recession until next year. This scenario would open the possibility of a second half equity rally that ultimately fails – another bear market rally.
Scenario 3: the Fed pivots just at the right time and by the right amount for the economy to avoid a recession. Non-recession bears decline an average of 25.0% over 9.1 months. Over the past 50 years, they have averaged -18.0% over 6.8 months. The implication is that if Powell can pull off this type of goldilocks scenario, the cyclical bear market is likely close to being over.
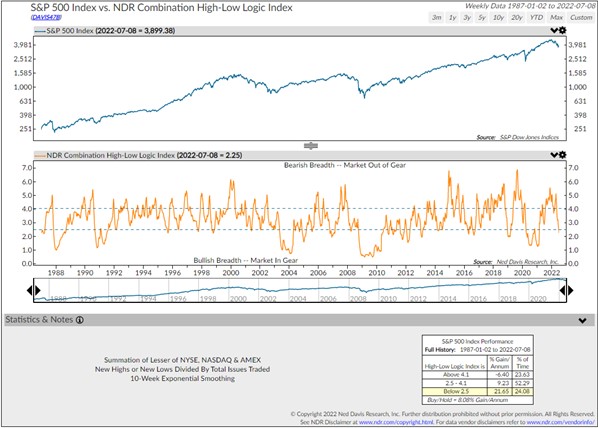
Shifting from macro above to technical – on Friday, a bullish signal registered on something called the High-Low Logic Index. The most important part of chart change (below) is that the signal moved into a level that it has occupied 24% of the time since 1987 and the market has gained +21.65%/yr when in that same zone. It should be recognized that this signal can be early – it was in 2008. However, in contrast to earlier signs that equities were out of gear, this new signal is encouraging.
What’s needed now is enough breadth improvement to conclude that the current market recovery is more than the kind of bear market rally that took place in March and May, both followed by renewed weakening to new lows. Combining this fresh bullish signal with the possible scenarios above, it does tilt the probabilities away from Scenario 1 – the most painful one of the three for our immediate future.
Be well,
Mike