July 25, 2022
Good morning,
It’s a Fed week this week (Rate hike and Chair comments Wednesday afternoon), and evidently it is starting on an optimistic note, judging by the bounce in equities and bond yields early this morning (Futures +.5%). I’m not sure the next 48 hours of market action for stocks and bonds will amount to much ahead of the Fed meeting – it could be summer doldrum quiet.
That said, let’s have some fun this morning and look at one of the most popular charts in the vast collection of charts in the Ned Davis Research Universe – the Cycles Composite Chart. Fun, because ironically the Cycles Chart’s calculus is not used in any of the data driven models beneath any client portfolios. Despite its popularity, the Cycles chart is not a forecast. It can be best thought of as history’s guide for how a given year could unfold.
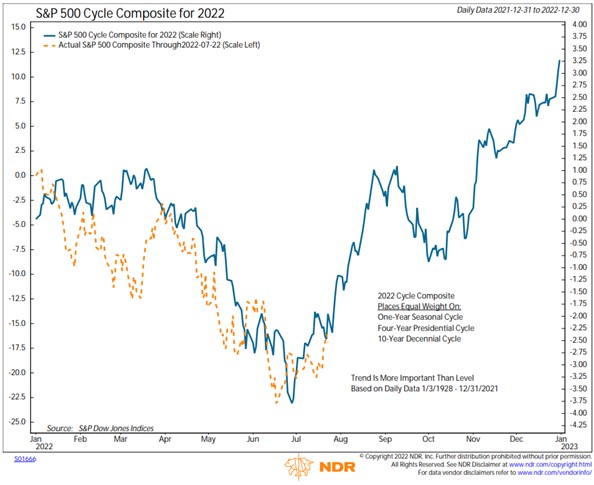
The composite is the combination of three historical price patterns (overlaid one on top of the other to produce the blue line above): the one-year cycle, the four-year cycle (mid-term years for 2022), and the 10-year cycle (years ending in two). The Chart’s trend is more important than level – averaging almost 100 years of data over three time periods compresses volatility. Some years, like 2019, markets track the cycle composite closely. In other cases, like 2008, outside forces dominate historical tendencies.
The one-year cycle is pretty set, with 93 years of data, each additional year will not greatly impact the pattern. The market tends to experience a rally to start the year, a spring pullback, a summer rally, a longer autumn correction, and a yearend rally.
The four-year cycle is also called the presidential cycle because its rationale is based on the market’s tendency to react to fiscal and monetary policy. Politicians may claim that they do not manage the economy for reelections, but chart history suggests they do. Monetary and fiscal policy has tended to peak after presidential elections, decline through most of the midterm year, trough shortly before midterms, and accelerate into the presidential election. The stock market has roughly followed that pattern.
The rationale behind the 10-year cycle is that the economy tends to follow a 10-year cycle that is reflected in the stock market. The 10-year cycle bottoms in late June of its 10th year. Several years ending in two have major bottoms, including 1932, 1942, 1962, 1982, and 2002. Each of those years saw the end of recessions or slowdowns. Economic conditions need to improve, at least temporarily, for the market to follow the 10- year cycle’s second-half rebound this year.
Again, just for fun, we don’t want to overthink the Cycle Composite’s strong second-half message, but it stands to reason that a less hawkish Fed and reduced recession risks would support the case for the current rally to continue into year-end.
Be well,
Mike