October 26, 2022
Good morning,
Our young (now 9-days old), emerging rally in equities has had a good start to the week with the S&P 500 Index up +2.83% over the past two days. It has rallied right into its first wall of overhead resistance on its chart – its own steeply declining 50 dma (day-moving-average). And as often happens at levels of overhead resistance, the rally looks like it will pause this morning with Futures off -70 bps (-0.7%) about 90min before the open. Google and Microsoft reported last night after the close and while their reported numbers weren’t far from expected, it was their forward guidance that has them both lower before this morning’s open.
If our rally has legs, it should be able to digest this kind of news and move on – but maybe not today, because the earnings day of this earnings season is tomorrow. Apple is the current market’s true bellwether stock and it alone represents a whopping 7.5% of the entire Index by market capitalization. Plus, Amazon reports tomorrow too. Amazon is no slouch as it is 3.5% of the S&P 500 Index (3rd on the list under Microsoft at #2). MSFT, AAPL, and AMZN – almost 17% of the Index considered to be the reflection of the U.S. economy. You can see then why our emerging rally may pause here.
____________________
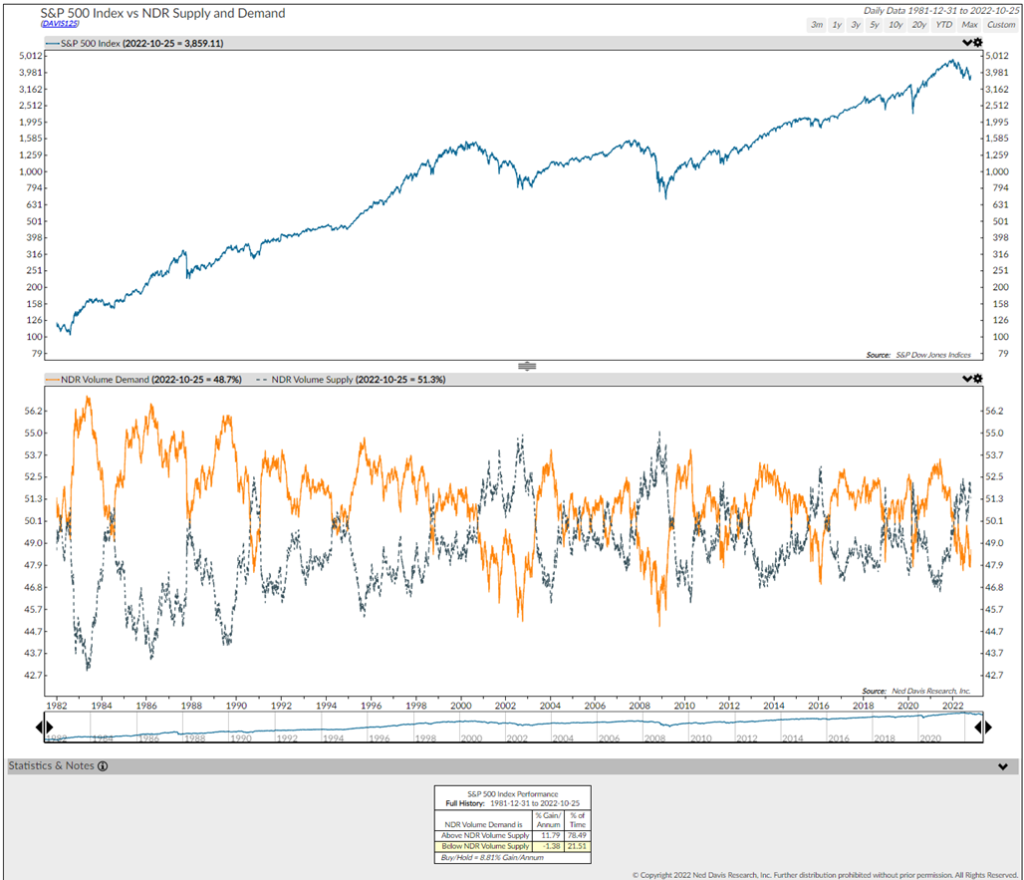
I promised geekiness and charts today. Supply and Demand are technical indicators that are cited so often that they have almost become jargon. They aren’t. Ed Clissold, Chief U.S. Equity Strategist at Ned Davis Research does a superb job of explaining the indicators of Supply and Demand and why they need to give a positive signal if we are to believe that any rally this quarter is more than a bear market rally.
For every buyer there is a seller, so the concept that demand is greater than supply or vice versa is a bit of a misnomer. Price is the final arbiter of where supply and demand meet. To infer if investors are more interested in acquiring or relinquishing stocks, we can measure the volume of stocks that rose or declined over a given period. One way to verify advancing and declining volume is by comparing the NDR Volume Supply and Demand indices (chart, below). Whereas the NDR Volume Supply Index is a running total of declining volume, the NDR Volume Demand Index is a running total of advancing volume. All the net gains in the S&P 500 since 1981 have come when volume demand has been above volume supply. Volume supply has been greater than demand since March 29. Like other intermediate-term technical indicators, it did not confirm this summer’s breadth thrusts. Extreme pessimism and potential macro improvements could trigger a year-end rally, but volume demand needs to eclipse volume supply for the rally to be sustainable.
Be well,
Mike