November 23, 2022
Good morning,
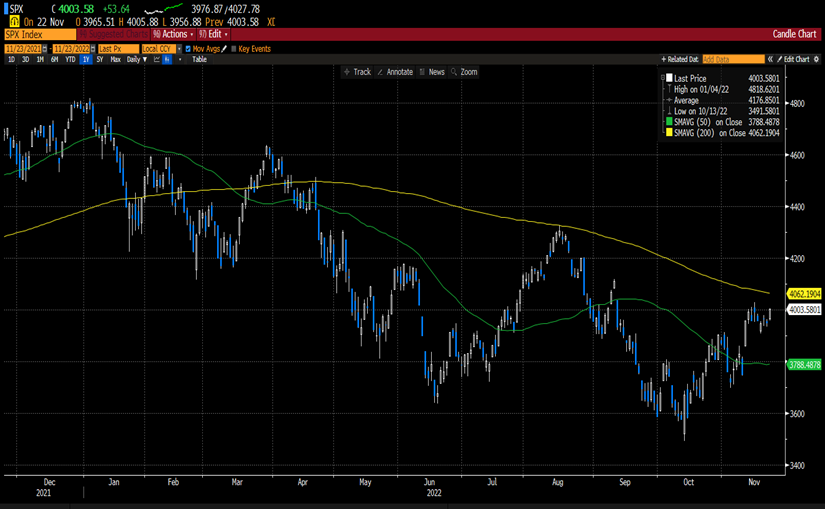
From a technical perspective, bond yields declined again yesterday, and stocks reacted in kind by jumping up +1.36% on the S&P 500 Index. The S&P closed above 4000 again after being repelled from that round number resistance zone last week. (see the Bloomberg chart below for reference). The big bad 200 day-moving-average (“dma”), which is the yellow line, normally a stiff resistance level for a rally (see August), looms just above yesterday’s close and will be the next challenge for our rally. Convincingly breaking above the 200-dma would support the notion that our short-term rally may be more than that.
Technical analysis is one component of our market analysis process and is important because it typically leads the fundamental and macroeconomic data. It is common to try to foot the future macro path for the economy with the market’s current technical signals. Translated: what might the market be signaling today about the economy tomorrow?
A higher anticipated peak in the Fed rate is being accompanied by a subsequent steeper fall in rates, contradicting the Fed’s message of “higher for longer.” What has been increasingly apparent since the Fed’s hardline is that the market has finally got the message that rates are going higher. Over the last several weeks, traders’ expectations for the peak rate have been greater than that implied by the Fed’s Dots for the first time in their history. But the market does not believe the economy will be able to sustain higher rates for long. In fact, the higher the peak rate, the bigger the subsequent Fed pivot, i.e., “higher for shorter.” Aha!
Happy Thanksgiving to you all. Have a great weekend. See you Monday.
Be well,
Mike