January 27, 2023
Good morning,
If chart analysis isn’t your thing, I wouldn’t blame you if you hit the delete button right now. We’re going to look at Bloomberg’s 1yr price chart of the S&P 500 Index this morning and compare it to “The market will trade in the same range it has been in for the last six months (S&P 500 high of 4300, low of 3500)” from Wednesday’s Morning Note.
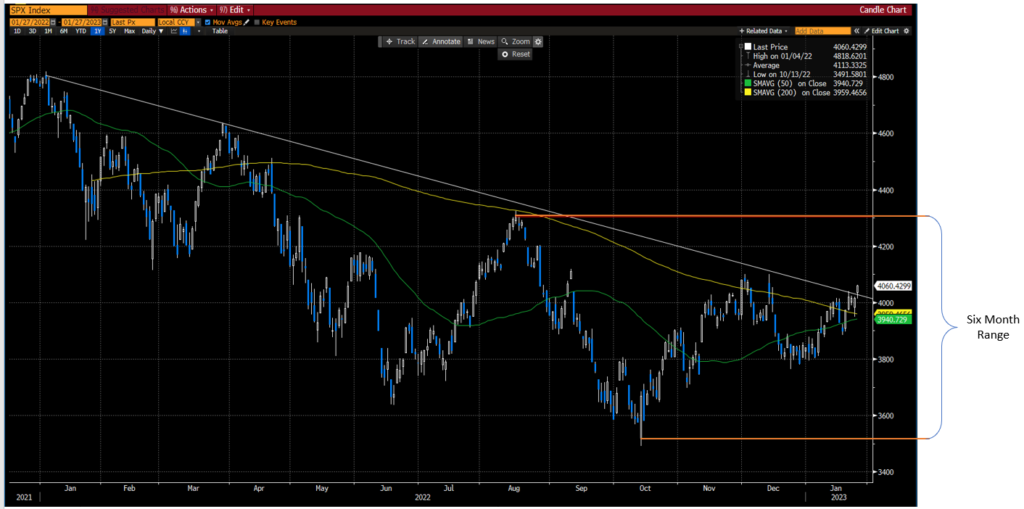
Looking at the chart, it is easy to see why strategists are getting so bullish (aside: and pushing sentiment well into the short-term bearish over-bought zone in the process). The dominant bear market downtrend line (white straight -45 degree line) that rejected each top of the previous bear market rallies was positively broken yesterday. Put that on the bullish side of the ledger. The green 50 day moving average (dma) is about to positively cross the still declining yellow 200 dma. When/if it does it will be another bullish sign. The index itself is about to take out its own November high (4080) and for the first time in a year, set a higher high following a higher low (the very definition of an uptrend). When/if that happens, technicians will officially call the bear market over. Another bullish development.
Let’s imagine that our now confirmed bull market rally (assuming it closes above 4080 soon), continues to rally to the upper end of the 6mo range at 4305 to be exact. That is a bit more than +6% above last night’s close and about +13% from the start of the year. It would be a nice rally, right into the most anticipated recession, maybe in history. Earnings do not go up a great deal in recessions, even the soft-landing kind of recessions. That means that P/E (Price/Earnings Ratio) valuations may be stretching quickly back into extreme over-valuation levels as the numerator rises against a flat denominator. I believe that stretched valuations will be the ceiling on our new bull market if it just gets to the top of its recent 6mo range.
Having said all that, let’s enjoy the rally, but beware that it is unlikely to be the kind of robust rally that central bank stimulus has produced over the past several years. And add that rallies tend to leave the market overbought. The NDR Trading Sentiment Composite (pictured earlier this week) has moved into the high end of its excessive optimism zone, suggesting the market is vulnerable to a near-term pullback.
Be well (and have a nice weekend),
Mike