February 21, 2023
Good morning,
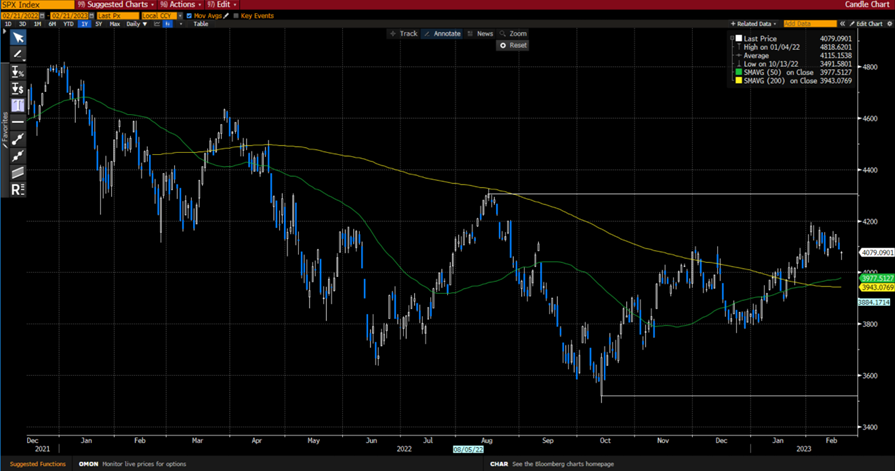
At the end of last year, what I thought was the most salient equity market forecast for the first half of 2023, that stocks would likely trade within the same range in the coming 6-months as they had in the last 6-months, was accompanied by a chart of the S&P 500 Index with those boundaries drawn. The same chart, updated through Friday, with the same boundaries, is below.
Many technical analysts (technicians) have declared an end to the bear market. That is possibly true, but their bull market is off to an unusually slow and narrow start if that is the case. The bears claim that this is the mother of bear market rallies, and new lows are right around the corner. This is also possible, but there is no denying the change in trend of the market which suggests that if new lows are in this market’s future, they are not likely to be in the near future.
The Bloomberg chart below does support the notion presented in last Friday’s Morning Note – that the market may have gotten ahead of itself in anticipating a mid-2023 recession and could be pricing out near term economic risks. This, however, does not address a possible recession late this year or next, and the market discounting that event months from now.
Be well,
Mike