August 17, 2023
Good morning,
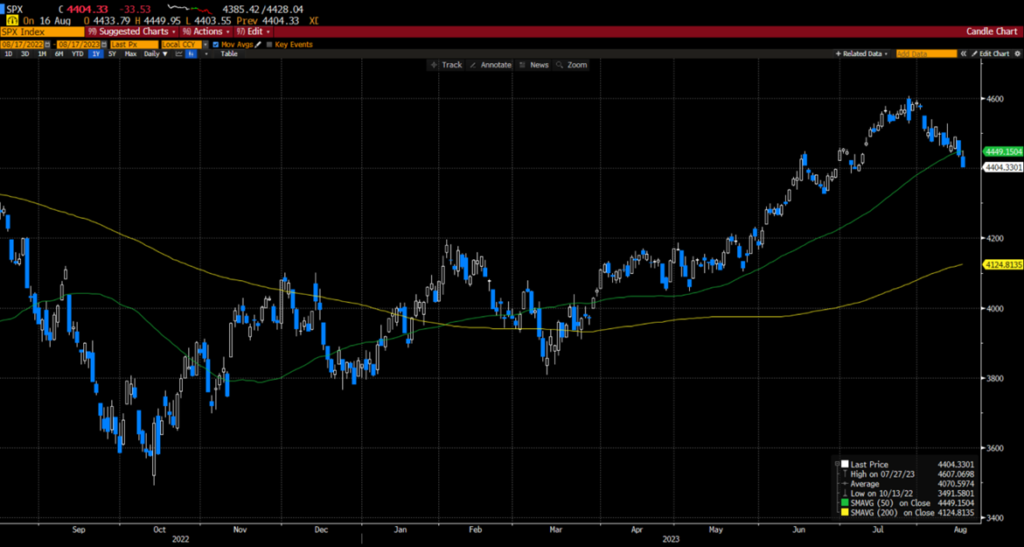
Welcome back! When we last left our heroes, Mr. Bond and Ms. Stock, in early August, investor complacency was elevated, and fears of a recession were all but doused. However, markets were entering the toughest two months of the year (historically) in an extremely overbought condition. Looking at the 1yr Bloomberg Chart of the S&P 500 Index below we see an overdue correction began on August 1. So far, the S&P is down -3.93% for the month through last night. However, almost every other major index; the NASDAQ Comp, the Russell 2000, Int’l Developed and Emerging Market Indexes are off about -6% by comparison. Bonds have faired no better. This morning’s headline: “Global Yields March to 15-Year Highs as Rate-Hike Worries Build,” nicely depicts the angst in bond land currently.
Correction or worse? So far, the technical evidence does not yet support the notion that this month’s decline in stock prices is anything more than a correction. 4200 on the S&P 500 is significant support (a decline of -8.6% from the 7/31 high) and is worthy of being a proverbial line in the sand. Above that line – correction / Below the line – something worse.
Clearly, there is much more to the analysis than a one-line chart. But, we’re far enough away from down 8% that we can fill in a full Technical/Quantitative analysis as we (likely) get there.
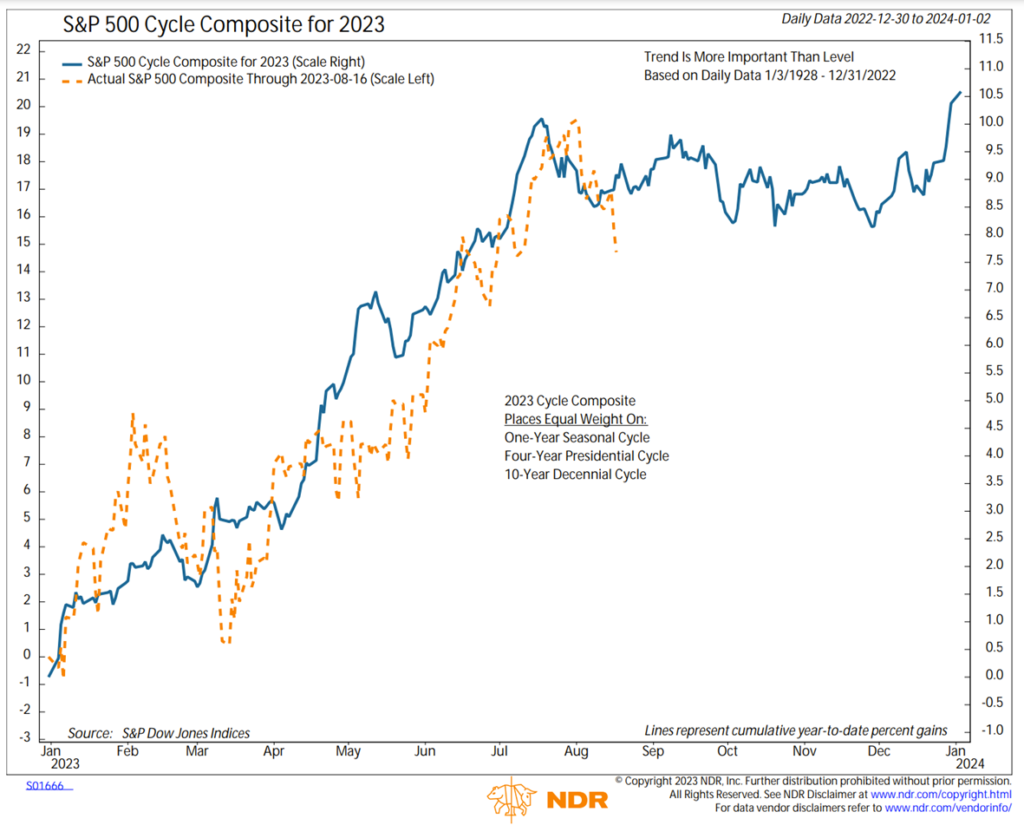
I’ll leave you this morning with one more chart and another headline. The updated cycles chart below (the 2nd chart), supports the notion of only a correction, the headline supports something worse.
Headline: “Buffett Pumps up Cash, Wary of Economic Turbulence”
Be well,
Mike