October 19, 2023
Good morning,
There is a lot of head scratching in the fixed income markets as to why yields are climbing like a run-away freight train. On Tuesday, bonds plunged again, pushing the US two-year yield to its highest level since 2006. There are a variety of possible reasons – exponentially growing debt burdens, persistent and possibly climbing inflation, a falloff of international buyers of US Treasury’s, growth, and financing more war around the globe – but a clear understanding behind the move remains a mystery. Markets do not like mystery (a.k.a. uncertainty). Tuesday also saw two solid economic reports; retail sales and industrial production both surpassed every estimate. While the S&P 500 Index (SPX) was little changed on the day, attention moved to Swap contracts tied to the Fed’s future decisions. They began pricing in roughly 60% odds that policymakers will raise interest rates by another quarter percentage point in January and holding steady in November and December.
Treasuries continued their selloff yesterday and it seemed too much for equities to bear. SPX was off 1.34% on the day.
Yet again, yields are higher this morning with the long bond (30yr) above 5% (5.04%), the 2y now at 5.25% and the rest of the curve in-between knocking on 5%’s door (10yr at 4.96%). Jerome Powell is speaking today at noon in NY. If he doesn’t say anything to stem the tide of yield advance, then it could accelerate further. A number of Fed officials have pointed out the tightening impact of the rise in Treasury yields over the past few weeks, and certainly the equity market weighed in yesterday. While the Bloomberg Financial Conditions Index suggests that things aren’t particularly tight by the standards of the past couple of years, credit spreads say differently and are widening. It’s likely that Powell will be less hawkish today but not do an about-face that sets the rate-cut clock ticking.
Our now one-year old bull market has been one of the weakest in history. Except for 7 -8 elite large caps, which have boomed, the other 492 stocks in the SPX have been flat. The largest, fastest rate tightening cycle for the past 18 months probably has a lot to do with this bull market’s meager overall performance, but it begs the question of how much more in higher yields can a weak bull sustain before breaking.
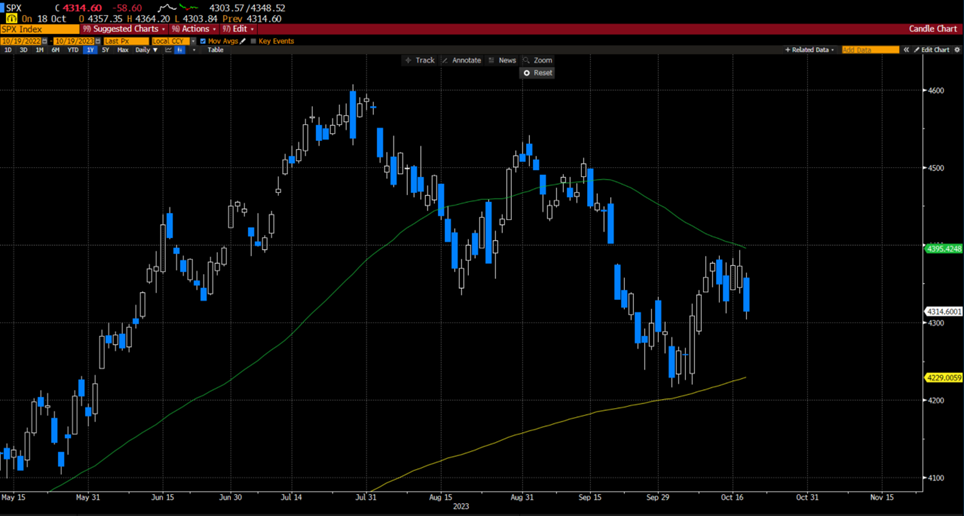
I don’t know the answer, no one does, but it is a good time to look at the tape for clues. Stocks bounced up and away from the major line of support at SPX 4200 – see Bloomberg chart below. I still think that the support zone (there are several support lines converging at ~4200, making it an important zone) and the market’s ability to remain above it or not is the best telltale of the equity market’s ability to sustain “Higher for Longer.” Surely, we will see.
Be well,
Mike
Disclosures
Investment advisory services offered through Robertson Stephens Wealth Management, LLC (“Robertson Stephens”), an SEC-registered investment advisor. Registration does not imply any specific level of skill or training and does not constitute an endorsement of the firm by the Commission. This material is for general informational purposes only and should not be construed as investment, tax or legal advice. It does not constitute a recommendation or offer to buy or sell any security, has not been tailored to the needs of any specific investor, and should not provide the basis for any investment decision. Please consult with your Advisor prior to making any investment decisions. The information contained herein was compiled from sources believed to be reliable, but Robertson Stephens does not guarantee its accuracy or completeness. Information, views and opinions are current as of the date of this presentation, are based on the information available at the time, and are subject to change based on market and other conditions. Robertson Stephens assumes no duty to update this information. Unless otherwise noted, any individual opinions presented are those of the author and not necessarily those of Robertson Stephens. Performance may be compared to several indices. Indices are unmanaged and reflect the reinvestment of all income or dividends but do not reflect the deduction of any fees or expenses which would reduce returns. A complete list of Robertson Stephens Investment Office recommendations over the previous 12 months is available upon request. Past performance does not guarantee future results. Forward-looking performance objectives, targets or estimates are not guaranteed and may not be achieved. Investing entails risks, including possible loss of principal. Alternative investments are speculative and involve substantial risks including significant loss of principal, high illiquidity, long time horizons, uneven growth rates, high fees, onerous tax consequences, limited transparency and limited regulation. Alternative investments are not suitable for all investors and are only available to qualified investors. Please refer to the private placement memorandum for a complete listing and description of terms and risks. This material is an investment advisory publication intended for investment advisory clients and prospective clients only. Robertson Stephens only transacts business in states in which it is properly registered or is excluded or exempted from registration. A copy of Robertson Stephens’ current written disclosure brochure filed with the SEC which discusses, among other things, Robertson Stephens’ business practices, services and fees, is available through the SEC’s website at: www.adviserinfo.sec.gov. © 2024 Robertson Stephens Wealth Management, LLC. All rights reserved. Robertson Stephens is a registered trademark of Robertson Stephens Wealth Management, LLC in the United States and elsewhere.