Monthly Market Summary
- The S&P 500 Index returned -0.9%, outperforming the Russell 2000 Index’s -2.3% return. Technology was the top-performing S&P 500 sector, followed by Consumer Staples, Industrials, and Utilities. Energy returned -13.9% as oil prices fell -18.6%.
- Bonds ended the month unchanged despite intra-month volatility, with the U.S. Bond Aggregate posting a +0.4% total return. Corporate investment-grade bonds produced a -0.3% total return, underperforming corporate high-yield’s +0.1% return.
- International stocks traded higher and outperformed the S&P 500. Developed Markets gained +3.7%, while Emerging Markets returned +0.1%.
Markets Rebound from an Early-Month Selloff as Trade Tensions Ease
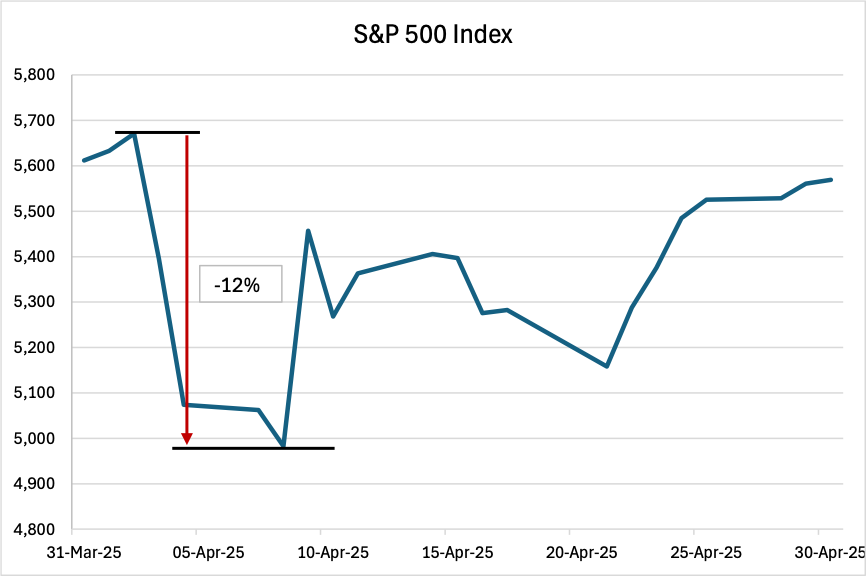
Stocks declined in early April after the White House unveiled sweeping tariffs, with the S&P 500 falling over -10% in the first week. However, after the administration paused tariffs and trade tensions eased, the S&P 500 rebounded to finish the month with a loss of less than -1%. Interest rates were volatile in April as the market navigated tariff headlines and economic uncertainty but ultimately ended the month unchanged, with Treasury and corporate bonds flat. Outside the stock and bond markets, gold surged to a record high amid increased market volatility. Elsewhere, the U.S. dollar weakened due to concerns about the direction of U.S. policymaking. As discussed below, Washington policy has had a significant impact on global markets this year.
An Update on This Year’s Biggest Market & Economic Trends
This year’s major market trends have centered around a key theme: rising policy uncertainty. There’s been a notable shift in Washington policy, with the introduction of tariffs leading to increased caution among businesses and consumers. The uncertainty is impacting financial markets, which are focused on how tariffs will affect future economic growth and corporate earnings. Recent economic data indicates that tariffs pulled forward some consumer demand, but forward-looking surveys suggest growth could slow as policy uncertainty delays spending and investment decisions.
2025 has seen a significant change in stock market leadership. The Magnificent 7, a group of leading mega-cap technology stocks, is down over -15% year-to-date after gaining over +60% in 2024. In contrast, defensive sectors are outperforming. Utilities, Consumer Staples, Health Care, and Real Estate have all traded higher this year, even with the S&P 500 down -5.1%. Global stock market leadership has also shifted. International stocks outperformed the S&P 500 in Q1 for the first time since Q3 2023, marking one of their strongest quarters of relative performance since 2000.
The bond market is experiencing increased volatility, with Treasury yields moving sharply in response to tariff developments, fiscal debt concerns, inflation risk, and economic uncertainty. Corporate credit spreads, which tightened to 2007 levels late last year, have widened, causing high-yield bonds to underperform as investors price in a wider range of potential outcomes. Meanwhile, the Federal Reserve’s rate-cutting cycle remains on hold as it balances inflation with the potential for slower economic growth. The market is now forecasting four interest rate cuts in 2025, with the first cut expected in June.
The Markets Last Quarter
Equities
The S&P 500 returned -0.7% in an uneventful month. Jussst kidding. The announcement of tariffs much larger and broader in sweep than expectations on “Liberation Day” (April 2) sent markets in a tailspin across asset classes. The S&P 500 plunged 12% in four trading sessions and briefly hit bear territory (off 20% its recent February high) as markets began to price a substantial economic slowdown and higher inflation as the result of a potential full-blown trade war. The index rebounded the following week upon the announcement of a 90-day tariff pause but volatility remained high as traders reacted wildly with every passing headline; bond yields surged as consumers ratcheted up inflation expectations and President Trump indicated he’d like to fire Fed Chair Powell but retreated later in the month as he backtracked off those comments. A good start to the earnings season allowed markets to almost fully recover at the month end. Mid cap stocks (-1.0%) and small caps (-2.3%) faired a little worse than large caps. Information technology (+1.6%) and consumer staples (+1.2%) were the best performing sectors in the S&P 500; energy (-13.6%) and healthcare (-3.7%) were the laggards. EAFE markets returned 4.6% in April with strong results across Japan (+6.8%), the U.K. (+5.2%) and Europe (+4.4%) aided by a plunging dollar and a flight out of U.S. equities. EM returned 1.3% led by Brazil (+5.1%) and India (+4.8%) but dragged down by China (-4.3%) which will likely bear the highest burden of tariffs.
From a valuation perspective, only U.S. large caps trade above +1 standard deviation based on historical forward P/E ratios with the S&P 500 at +1.4. The NASDAQ is at +0.6. For the next 12 months, EPS growth for S&P 500 is expected to be 8.1% (vs. 6.9% annualized over the last 20 years). For the next 12 months, EPS growth for NASDAQ is expected to be 14.4% (vs. 10.7% annualized over the last 20 years). Equities across markets caps in the U.S., and in non-U.S. developed and emerging markets, trade at or above their 20-year averages based on forward P/E ratios.
Fixed Income
Investment grade fixed income asset classes had mixed returns amid rate volatility and widening spreads. Municipals returned -0.7% (-0.5% YTD) due to supply-demand technical. The Bloomberg Aggregate Index returned +0.4% (+3.2% YTD) while investment grade corporate returns were flat (+2.3% YTD). High yield bond returns were flat (+1.0% YTD) as spreads widened 37bps, though they had spiked over 100bps intra-month before retreating. Leveraged loan returns were also flat (+0.4% YTD) during April. Emerging Market debt returned -0.3% (+1.3% YTD) as US dollar fell 4.6% and spreads widened 33bps.
Rates
Rates fell at the short and intermediate portions of the curve but rose at the long end amid high volatility as investors grappled with the potential for stagflation (higher inflation and slower economic growth) due to the announced tariffs. The unwind of levered treasury trades and headlines around President Trump potentially “firing” Fed Chair Powell also contributed to wild swings in yields. The recession-watch 3M-10Y spread compressed 3bps and has gone negative again at -13. The 2Y-10Y spread widened 24bps to +56. Rates fell sharply in other developed markets. The spread between Italian and German 10Y bonds is 1.12%. 5-year breakeven inflation expectations fell 32bps and now sit at 2.31%; 10-year breakeven inflation expectations fell13bps and now sit at 2.24%; the 10Y real yield fell 9bps to 1.92%. The market now expects between three and four cuts in 2025 vs the Fed’s guidance of two cuts. At year-end 2025, the market expects the Fed Funds rate to be 3.5% vs. the Fed’s guidance of 3.75%-4.00%.
Currencies/Commodities
The dollar index plunged 4.6% as investors fled out of U.S. assets. The commodities complex fell 8.4% with energy prices falling 16.2% as investors began to price in a global slowdown and due to a falling dollar. Brent prices fell 15.5% to $63/bbl. US natural gas prices fell 19.3% and European gas fell 16.3% both based on expectations slower economic growth.
Market Monitors
Volatility rose for stocks and bonds (VIX = 22, MOVE = 112). Market sentiment, which has been weak all year, fell further from -25 to -34.
Charts of the Month

Source: Bloomberg 4/30/25