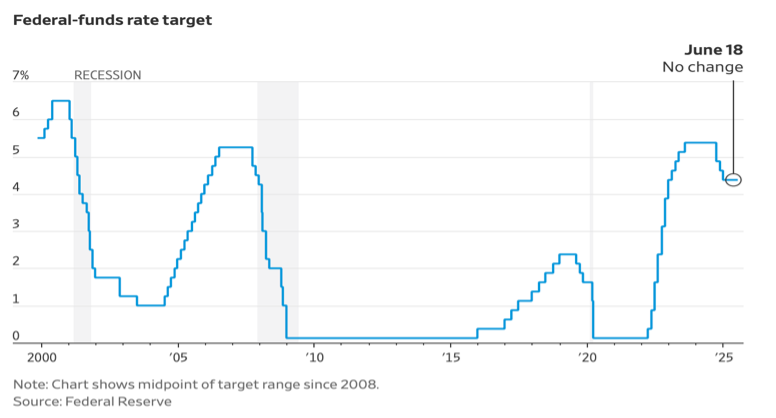
The Federal Open Market Committee (FOMC) of the Federal Reserve concluded its latest interest rate meeting on June 18, leaving interest rates and overall monetary policy unchanged. Unlike the last meeting in early May, when tariff chaos abounded and the Bureau of Economic Analysis had just announced that US economic growth was negative in the first quarter, Federal Reserve Chairman Jerome Powell expressed a high level of comfort with current economic growth hovering around 2.5%. Nevertheless, inflation is not yet at the Federal Reserve’s target of 2%, and the upward threat from tariff-induced price increases remains.
The impact of higher-for-longer interest rates is most noticeable in medium-sized and smaller businesses. Whereas the cost of debt for the S&P 500 has risen modestly since 2023, to an average of 4.4%, Strategas Research estimates that the average cost of debt in the Russell 2000 universe has risen considerably higher and faster, to 7.2%.
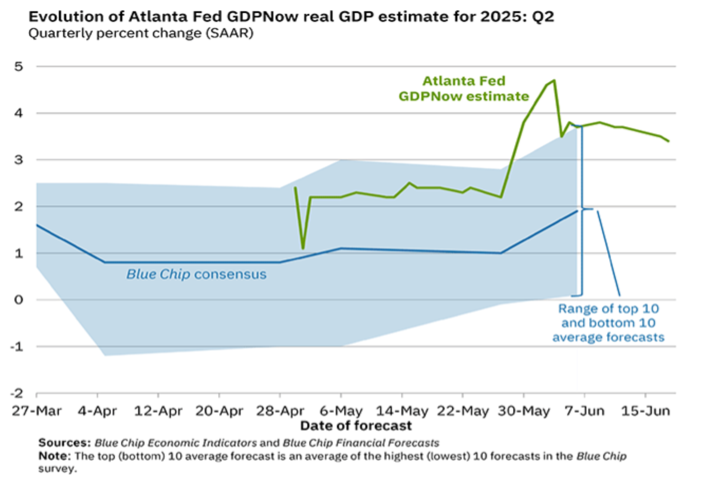
The Atlanta Federal Reserve Bank has provided current quarter estimates of GDP for more than ten years. GDPNow utilizes a model that compiles and evaluates monthly information as it becomes available, updating the estimate as data of major significance, such as retail sales and nonfarm payrolls, is released. The Blue Chip Consensus Forecast is another commonly used method for tracking economic growth; as the quarter nears its end, these two estimates often begin to converge. Although the sizeable disparity in economic forecasts for the second quarter shown in the current Blue Chip Survey is unusual, the central tendency of the Survey and the GDPNow estimates seems to be converging on 2.5% as the likely number for second quarter GDP growth – a substantial and surprising rebound from the weak first quarter.
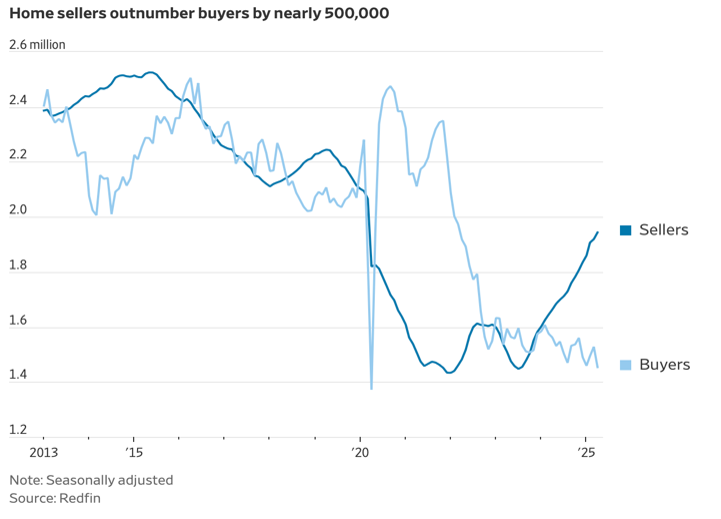
Strong US economic growth is all the more remarkable in light of the weakness of one key sector of the US economy: Housing. Home sales and housing starts have been consistently underperforming expectations, with May housing starts falling 10% to the lowest level since 2020. The level of home prices, without any mitigation from more favorable mortgage rates, continues to keep buyers out of the market. On the construction side, tariff-related increases in building costs (metals, lumber, HVAC equipment) and labor shortages are commonly cited as major obstacles.
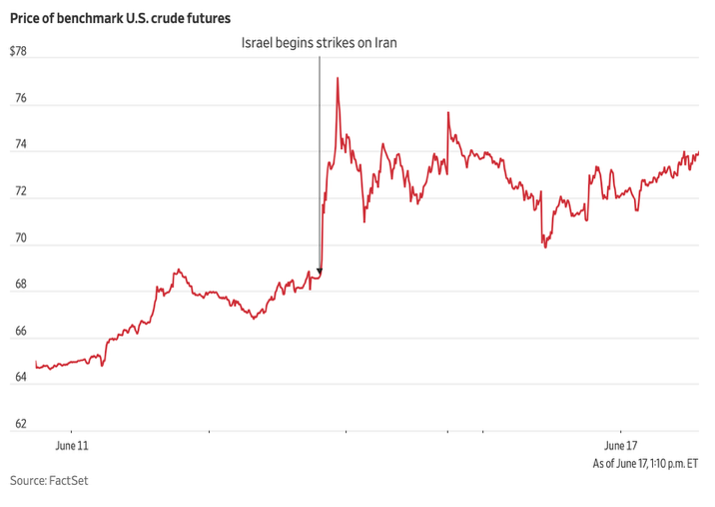
Two weeks ago, oil markets were abuzz with controversy over the OPEC+ decision to increase oil supplies in a market where prices were already falling. War in the Middle East has now changed the tenor of the conversation. Given OPEC members’ desire to raise production back to pre-pandemic levels, it seems appropriate to assume that production shortfalls from Iran will be more than made up for by Saudi Arabia and others. Iran’s crude oil exports have hovered between 1.7 million barrels per day (mmbd) and 2.2 mmbd, with most of it going to China due to US sanctions. However, roughly 20% of the world’s oil and gas supply goes through the Straits of Hormuz, from a number of producers; if the Straits of Hormuz are closed to ship traffic, this chart will look VERY different in two weeks.
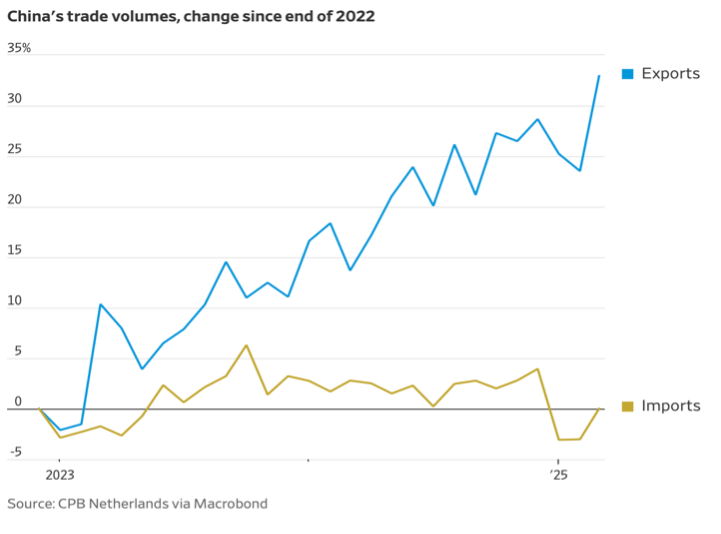
Chinese export and import activity has evidenced a notable divergence over the last two years. Import growth has been essentially flat, partly due to weak domestic consumption spending but also due to increasingly competitive domestic suppliers. Chinese auto manufacturers, for example, have become the dominant players in the huge Chinese auto sales market. At the same time, despite tariffs, export controls, and various embargoes, Chinese export growth has skyrocketed. Europe is increasingly on the receiving end of this export trade, attempting to redirect Chinese manufacturers away from dependence on US markets. Not surprisingly, the same political, if not social, discomfort with China’s aggressive export policy that has been witnessed in the United States is now showing up in Britain, France, Germany, and elsewhere in the EU.