By Avi Deutsch
July 10, 2025 – The past quarter saw the implementation of many of the policies promised by the new administration. These included:
- Tariffs: Though some tariffs were paused by the administration, others—including a baseline 10% tariff—went into effect in Q2. The effective tariff rate is estimated by JPMorgan to be 15%, up from 4% in 2024.[1] Tariffs are now generating significant revenue, estimated at $97.3 billion as of the end of June, up from $46 billion this time last year. It’s unclear yet if and how these tariffs will affect inflation.
- Immigration: The past few months saw a sharp increase in immigration arrests, including at farms, hotels, and restaurants. These resulted in protests and increasing concern from both business leaders and lawmakers from both parties, leading to a pause on some detentions. Simultaneously, border crossings remain at historical lows.
- The Big Beautiful Bill: Signed into law on July 4th, this bill is the administration’s signature legislative accomplishment and aims to make good on many campaign promises. Among other things, the bill makes the 2017 tax cuts permanent, increases tax exemptions for seniors, parents, and residents of high-tax states, and reduces Medicare coverage.
Across the board, it’s too early to say how these policies are impacting the economy. Tariffs are clearly raising revenues, but how this cost will be shared between foreign manufacturers, importers, and customers remains to be seen. Tariffs also resulted in companies overloading on inventory in Q1, distorting the GDP numbers. Finally, significant uncertainty remains as the latest pause on tariffs comes to an end, and trade deals remain sparse.
Immigration enforcement, meanwhile, could also drive up labor costs—especially for unskilled labor—and hence contribute to higher inflation. Further, the U.S. faces chronic labor shortages that are expected to worsen as the Baby Boomers continue to retire.
Finally, the details of the 900-page reconciliation bill will take some time to digest. Some aspects of the bill—such as tax cuts, the ability to expense R&D, and subsidies for chip manufacturers—are expected to stimulate the economy. Others, like cuts to Medicare and clean energy subsidies, will have the opposite effect. But perhaps most significantly, the bill is expected to increase the U.S. deficit by $2.4 trillion over the next 10 years.[2] The long-term impact of this is impossible to predict, but the national debt and deficit remain a formidable obstacle to the long-term health of the U.S. economy.
Against this backdrop, the major economic indicators—which of course lag the performance of the actual economy—continue to tell the story of a strong, if slowing, economy. The U.S. created 147,000 jobs in June, exceeding economists’ expectations.[3] So far in 2025, the average monthly job growth is around 144,000, below the 2024 average of 168,000. Inflation, meanwhile, has held steady at 2.4% (May CPI), with June estimates around 2.6%.[4] While we have not seen an increase as a result of tariffs yet, inflation remains above the Fed’s 2% target, and the recent downward trend appears to have stalled.
In summary, even as the administration’s policies are coming into shape, many unknowns remain about the details of such policies and their impact on the economy. Economists expect tariff and immigration policies to have an inflationary impact, while the new spending bill is both stimulative (lower taxes, subsidies for microchips) and restrictive (higher deficits, less spending on healthcare and clean energy) simultaneously. As the Fed has said, with so many unprecedented policy changes, the only wise approach is to wait and see how it all shakes out.[5]
The Markets
The second quarter of 2025 started tumultuously with a tariff announcement that sent stocks into near-bear-market territory. However, multiple reversals and delays on tariff policy contributed to a phenomenal recovery, and the S&P 500 set new highs and ended the quarter up 6.2% year-to-date[6]. Tech companies led the recovery, followed by the industrial and consumer discretionary sectors. Small-cap companies did not fare as well, ending the quarter down 1.8% YTD.
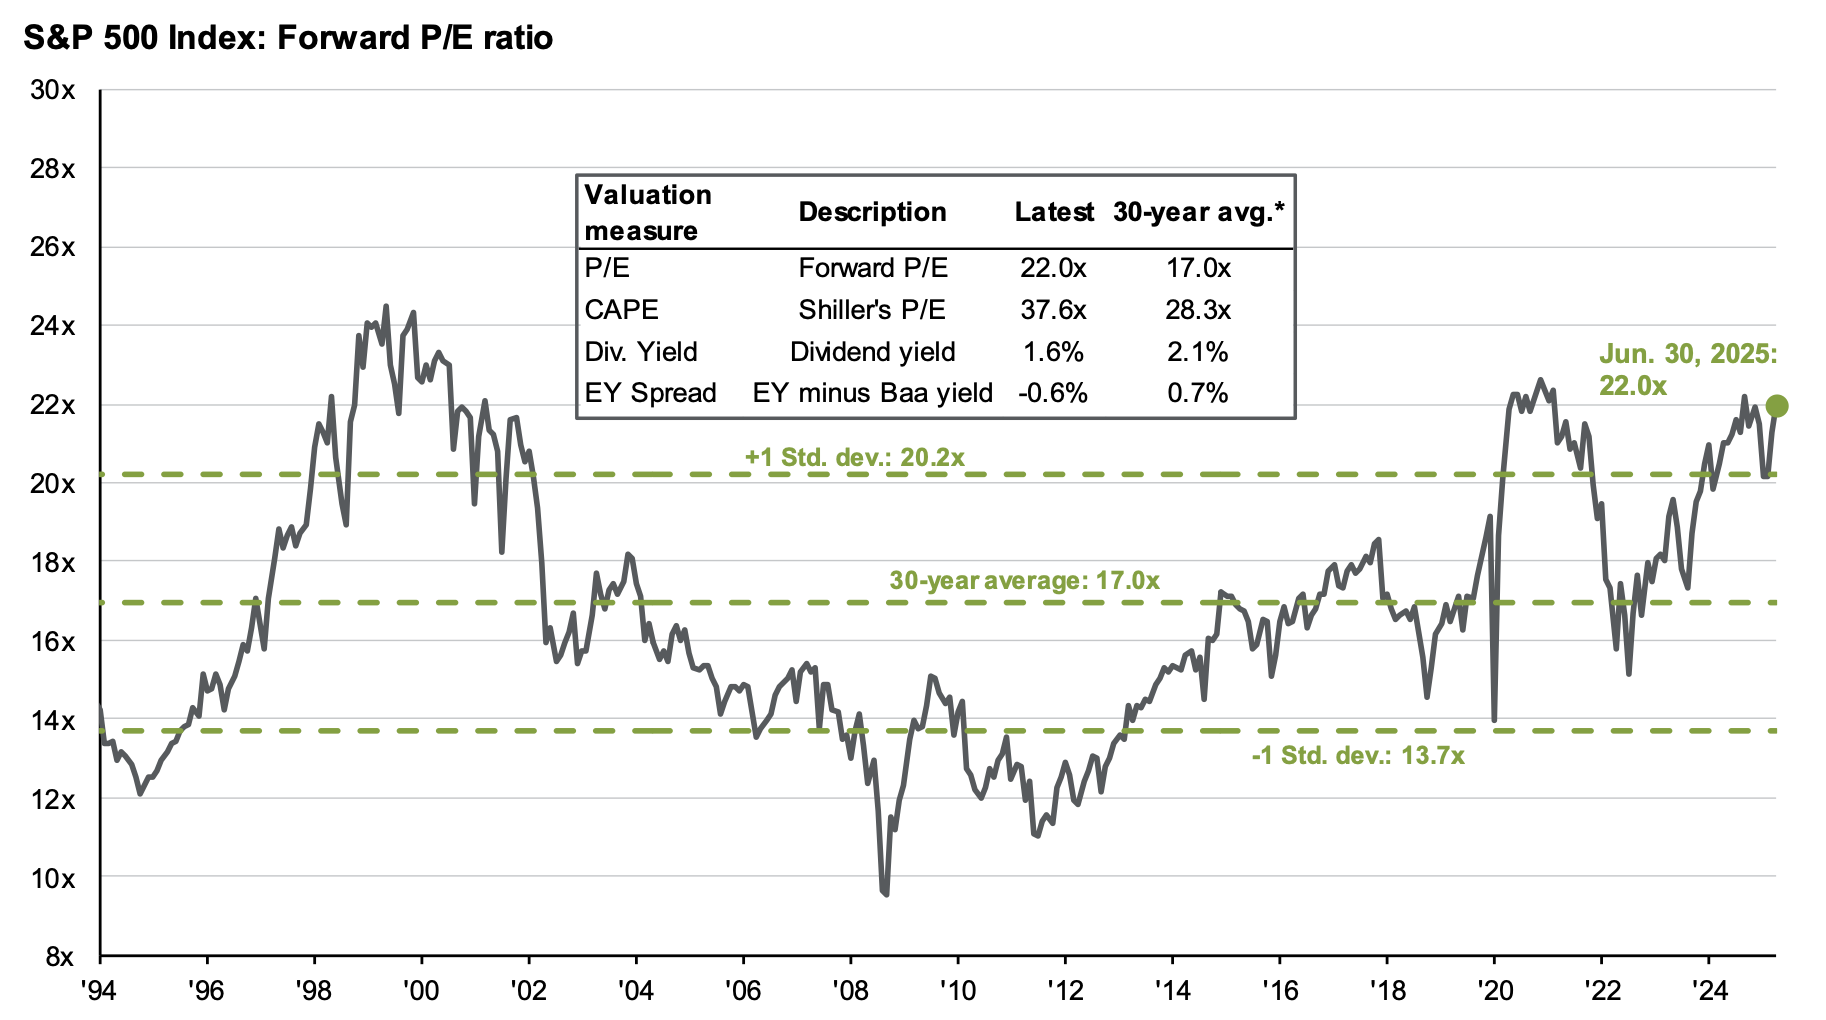
Source: Bloomberg, FactSet, Moody’s, Refinitiv Datastream, Robert Shiller, Standard & Poor’s, J.P. Morgan Asset Management. Forward P/E ratio is the most recent S&P 500 index price divided by consensus analyst estimates for earnings in the next 12 months, provided by IBES since March 1994 and FactSet since January 2022. Shiller’s P/E uses trailing 10-years of inflation-adjusted earnings as reported by companies. Dividend yield is calculated as consensus estimates of dividends in the next 12 months, provided by FactSet, divided by the most recent S&P 500 index price. EY minus Baa yield is the forward earnings yield (the inverse of the forward P/E ratio) minus the Bloomberg U.S. corporate Baa yield since December 2008 and interpolated using the Moody’s Baa seasoned corporate bond yield for values beforehand. *Average for dividend yield is since August 1995 due to data availability. Guide to the Markets – U.S. Data are as of June 30, 2025.
During the quarter, investors shrugged off the Israel-Iran conflict and continued tensions in the Middle East—a view that appears vindicated in retrospect, as the conflict had little impact on oil prices.
One of the largest stories of the year in the markets has been the weakening dollar. As of the end of Q2, the U.S. Dollar Index (DXY) is down 10.7% YTD. The cause appears to be a broad withdrawal from American securities—both stocks and bonds—driven by policy uncertainty, rising deficits, and concerns about Fed independence. A weakening dollar is not necessarily bad, as it makes U.S. exports cheaper relative to local goods abroad, and many believe the U.S. dollar remains overvalued. Still, the greenback’s weakness has raised concerns about the hegemony of the dollar as the global reserve currency.
A weakening dollar also drove outperformance in unhedged international indices. Non-U.S. equities have enjoyed a strong year, driven by expansive fiscal policies, a weakening dollar, and a flight from U.S. equities. The MSCI All-World Index ended the quarter up 10% YTD.
The bond market also saw a volatile second quarter, with concerns about the U.S. deficits sending long-term yields higher—only to soften again. The U.S. 10-year Treasury ended the quarter at 4.2%, below the Fed Funds Rate of 4.3%. This continued inversion suggests that interest rates remain restrictive, with a possible slowdown ahead.
The Outlook
As of this writing, a new deadline for trade deals has been set for August 1st, with a promise that these will not be delayed again. The markets appear doubtful of this announcement, and stock prices barely registered the risk of the previously announced reciprocal tariffs being reintroduced. Only time will tell if the hope of another tariff reprieve is merited. In the meantime, uncertainty remains—as it does over continued immigration enforcement, and the impact of existing tariffs on consumer prices.
With all this uncertainty in mind, the U.S. economy’s strong position provides some buffer to weather this volatility, and it may avoid a recession even if the combined impact of the new policies is restrictive. Equity markets, meanwhile, are operating with little margin for error, and we can expect more volatility here as tariff policies continue to evolve.
So far, the impact of the new administration’s policies has appeared muted, and the passage of the Big Beautiful Bill—which provides short-term stimulus—may continue shielding the economy from other policies. Still, much uncertainty has been introduced into the economy, and it doesn’t appear to be going away anytime soon.
Wishing us all a peaceful and happy summer!
— AMD
[1] JP Morgan Guide to the Markets – U.S. Data are as of June 30, 2025.
[2] https://www.crfb.org/blogs/breaking-down-one-big-beautiful-bill
[3] https://www.bls.gov/news.release/empsit.nr0.htm
[4] https://www.clevelandfed.org/indicators-and-data/inflation-nowcasting
[5] https://www.federalreserve.gov/newsevents/testimony/powell20250624a.htm
[6] Market data provided by the Robertson Stephens Investment Office