

Q2 2026 Executive Summary
Stocks staged a strong recovery in Q2, with the S&P 500 gaining +15% and finishing near record highs. The Middle East conflict and oil shock that started in Q1 continued for most of Q2, but oil prices fell as the two sides worked toward a ceasefire agreement. Meanwhile, investors’ enthusiasm for artificial intelligence (AI) stocks returned, fueling a rally in semiconductor stocks. As companies reported strong Q1 earnings, the gains broadened beyond technology to include mid-and small-cap stocks. Even as stocks rallied, market conditions continued to evolve. The spring rise in oil prices lifted inflation to a three-year high, and the Federal Reserve signaled a shift from rate cuts to rate hikes.
AI Spending Fuels Semiconductor Stock Rally
Semiconductor stocks led the market’s advance, posting their strongest quarter in nearly 30 years. The group returned +88% for the quarter and was up nearly +100% before pulling back in the final weeks of June. The only comparable quarters occurred in the late 1990s, when the internet went mainstream.
The rally was anchored to a wave of technology investment, with much of the money flowing to the chipmakers. The combined capital spending of five of the largest tech companies building AI infrastructure (Microsoft, Amazon, Meta, Alphabet, and Oracle) spent a combined $32 billion in 2016. By 2025, that amount had grown to roughly $416 billion. The pace continues to climb: the five companies are projected to spend about $724 billion this year and nearly $900 billion next year. The capital expenditures pay for data centers, the computer chips inside them, and the equipment and power to run it all. The companies leading the buildout are reporting record earnings and growing backlogs, and many say they’re limited more by how fast they can build than by demand.
The surge in spending is also reshaping financial markets. Private companies are going public to fund their spending, while public companies are turning to debt and equity markets to finance their buildout. SpaceX completed the largest IPO in history during Q2, raising $85 billion. Other well-known private companies, including OpenAI and Anthropic, are expected to follow over the next year. In the public market, companies such as Alphabet and Oracle are issuing both stock and bonds to fund their spending. The amount of money being raised, and the spending plans behind it, point to a buildout that is still expanding.
A move of this size, both the spending and the share price gains, is historic. The market is treating AI as a major technological shift, and the quarter brought increased spending and earnings growth, with companies signaling more spending ahead. At the same time, a quarter like this shows how much future growth is already priced in. The closest historical parallel, the late 1990s, points to what rapid transformation tends to bring: both real opportunity and high expectations.
Market Breadth Remains Strong Beyond Tech
Beneath the headline rally in tech, Q2’s gains were broad. The S&P 500 has gained +10.2% this year, but strip out the tech sector and that falls to +5.1%, an indication of how much of the index’s return has come from a single sector. The remaining market segments in the chart produced double-digit returns, outperforming the S&P 500. The S&P 400, an index of mid-cap stocks, and international stocks have both returned approximately +17%, while the small-cap Russell 2000 has gained +22%. For most of the past few years, the stock market’s gains were concentrated in a handful of mega-cap tech stocks. Market leadership has broadened this year, creating a more balanced market.
Several developments explain why the rest of the market has started to outperform. The first is profitability. Smaller companies’ profit margins weakened in 2022 and 2023 as inflation spiked and the Federal Reserve raised interest rates. Small caps tend to carry more floating-rate debt, so as the Fed cut rates in recent years, the interest savings flowed to their bottom line. The second is the economy. Smaller companies are more sensitive to domestic economic conditions, so the economy’s resilience has been a direct tailwind. There were concerns that this year’s oil shock would weigh on the global economy like past oil crises. However, today’s economy depends far less on energy than it did in the 1970s, and the impact has so far been relatively contained. The third is valuation. After years of tech stocks leading the market, smaller companies look cheaper by comparison, and their improving earnings have made that gap harder to overlook.
No single factor explains the shift, but together they make a fundamental case for why the gap has started to close. Profit margins are improving, the economy continues to expand, and parts of the market trade at valuation discounts. As this year has shown, holding a mix of company sizes, styles, and geographies means not depending on any single part of the market to do well.
Equity Market Recap – Key Trends During Q2
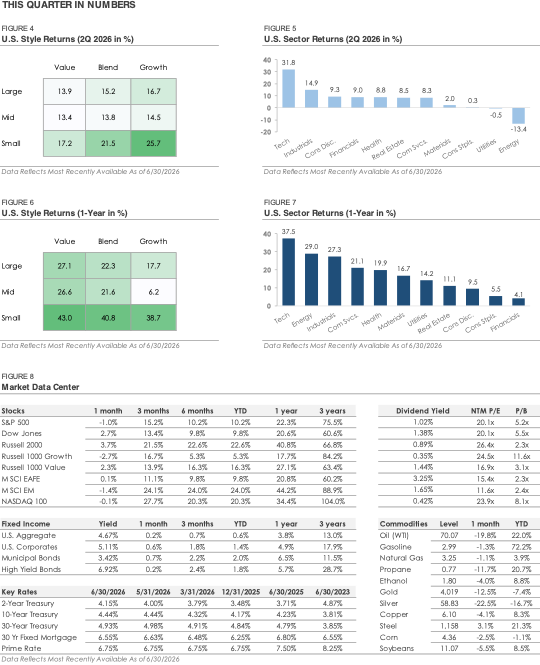
Equity markets traded higher throughout the quarter, with most of the advance coming in April as stocks rebounded from their late-March lows. The strength carried into May, with the S&P 500 posting a nine-week winning streak into month end. The index set a record high in early June before giving back some ground to finish up +15.2%, its strongest quarter since Q2 2020, the early stages of the pandemic recovery. The Nasdaq gained +27.7% as tech stocks led the market rally, while the Dow rose +13.4%. As mentioned, market breadth remained strong during the quarter. Smaller companies outperformed most major indexes in Q2, with the Russell 2000 gaining +21.5%.
Credit Recap – Bonds Trade Higher Despite Interest Rate Volatility
The bond market had another volatile quarter as interest rates tracked the path of oil. Treasury yields rose early during the quarter as oil prices remained elevated and the odds of a rate cut weakened, then reversed lower in June as energy prices declined and the inflation outlook improved. The 30-year Treasury was especially volatile, rising to its highest level since 2007 over concerns about oil, inflation, and a Fed leaning toward higher rates. Shorter-term yields, which are the most sensitive to Federal Reserve policy, also increased over the quarter as the market priced out additional rate cuts and began to weigh the possibility of a rate hike.
By the end of the quarter, the volatility had eased and yields stabilized. The Bond Aggregate, a broad index of U.S. investment-grade bonds, returned +0.7% for the full quarter. Corporate bonds outperformed during Q2, with high-yield gaining +2.4% and investment-grade returning +1.8% municipals returned +1.9%. Credit spreads, which measure the difference in yield between corporate and government bonds, retightened after widening in the spring as oil prices rose. Overall, credit spreads remain tight by historical standards, signaling continued confidence rather than concern. The one exception is the lowest-quality corner of the high-yield market, where CCC-rated bonds haven’t recovered to pre-conflict levels, an indication of some caution toward the weakest borrowers.
Warsh Rates Recap – Bond prices down / Yields Up
Rates rose across the curve and remained volatile through the quarter; towards quarter-end, markets were slightly surprised by the overall hawkish tone of new Fed Chair Kevin Warsh and began to reprice expectations for rate hikes this year with an eye on sticky inflation. For the quarter, 2-year rates rose 38bps to 4.18%; 10-year rates rose 15bps to 4.47%. The recession-watch 3M-10Y spread widened 1bp to +64; the 2Y-10Y spread compressed 23bps to +29. Rates were slightly lower to unchanged in other developed markets; the BTP-Bund spread is at 0.77%. 5-year breakeven inflation expectations fell 32bps to 2.27% (vs. recent high of 2.74% on May 4, 2026); 10-year breakeven inflation expectations fell 7bps to 2.23% (vs. recent high of 2.52 on May 4, 2026); the 10Y real yield rose 21bps to 2.23%. For 2026, markets now expect between one and two rate hikes. At yearend 2026, the market expects the Fed Funds rate to be 3.95%.
2026 Outlook – What to Watch in Q3
Stocks ended Q2 near all-time highs as they rebounded from the volatility earlier this year. The conflict behind that volatility isn’t fully resolved, but oil prices have fallen back to pre-conflict levels. There were concerns the oil spike would slow the global economy, like past energy crises, but the economy has held up so far with few signs of significant stress. What’s left is a set of open questions: the path of oil and inflation, the durability of the AI investment cycle, the strength of the job market, home price weakness, and whether the market’s broadening continues. The remainder of this year will be shaped by how each plays out.
Source: MarketDesk