

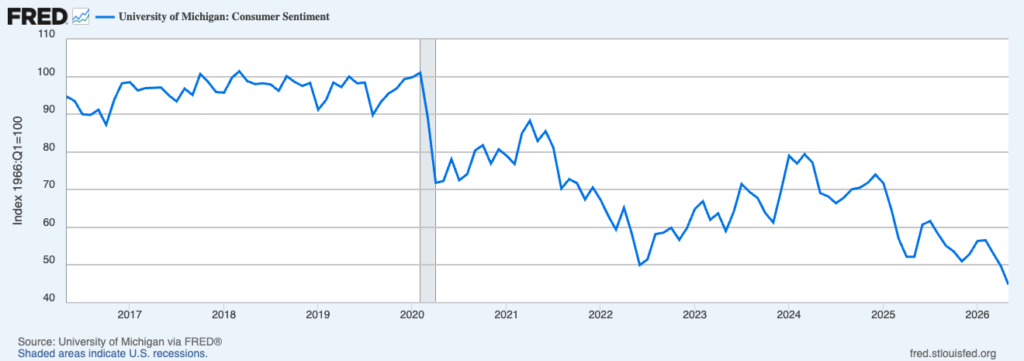
July 10, 2026 – The U.S. consumer is decidedly not happy. In fact, as Chart 1 shows, U.S. consumer sentiment currently sits at its lowest level in 10 years—worse than during the depth of COVID, the 40-year peak of 9% inflation of 2022, or the rate hikes of 2023-2024.
There are myriad reasons for this unhappiness, starting, of course, with inflation. After decades of stable inflation, the post-COVID spikes blindsided consumers and materially eroded their spending power. Ten thousand dollars in 2019 dollars is worth only $7,629 today, a 24% drop in purchasing power.[1]
The impact of this change is felt by anyone who has not seen a corresponding increase in their income. While real wages have barely moved (+1.0%) since 2019, there have been sharp divergences across sectors. Leisure & hospitality led all private sectors, with nominal wages rising 38.1% — outpacing inflation for a +6.7% real gain — followed by retail. Meanwhile, information-sector wages rose just 25.9%, resulting in a 2.7% real loss.[2]
The U.S. labor market remains tight, but not strong. New job growth has been anemic, averaging around 50,000 new jobs a month. The tightness is a result of systemic employee shortages as baby boomers retire, birth rates fall, and, after deportations, combined legal and illegal migration figures are now negative. Combined with fears of AI, this leaves employees feeling like they are stuck in their current positions, an unhappy reality with little hope of change on the horizon.
Exacerbating the feeling of economic despair is the continued growth of income inequality, currently discussed under the covers of the K-shaped economy and cost-of-living. In reality, the U.S. has long been a highly unequal economy, but COVID, inflation, and recent stock market gains have brought this dynamic to the forefront. While the economic pie continues to grow consistently, the share of gross domestic income going to employees has shrunk from a high of 58% in 1970 to 51% in the first quarter of 2026. Meanwhile, corporate profits have grown from 7% to 12% over the same period.[3]
Despite the low consumer sentiment reading, the U.S. economy continued soldiering along in Q2, even with the spike in oil prices, continued tariff uncertainty, and a shrinking labor pool. Unemployment remains at 4.3%, well below historical averages, and GDP growth remains on track, if slowed down by net imports.
In aggregate, the above data suggests that poor consumer sentiment has as much to do with the ‘vibe’ as it does with real economic conditions. Consumers are reacting to the fairness of income distribution, not just to absolute levels. Coupled with our toxic political environment, continuous display of alternate realities via social media, and fears of AI-replacement, the U.S. economy is best described as in a funk.
The Markets
The mood among investors could not be more different than consumer sentiment (despite the overlap between the two groups). After a weak first quarter that saw the S&P 500 decline 4.3%, the index rebounded in Q2, rising 15.2% for a total year-to-date gain of 10.2%.[4] Small-cap stocks enjoyed an especially strong quarter, ending a long period of lagging behind the S&P to finish the quarter up 22.6% YTD. Emerging markets also performed strongly, gaining 24.1% over the past three months.
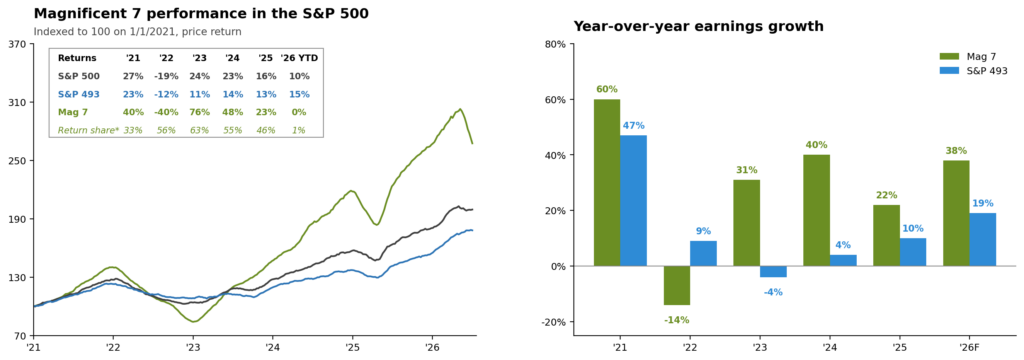
While much of the growth in the U.S. market remains linked to AI, the market has shown signs of a broader rally that defies the concentrated returns of the past few years. The Mag 7, the breakout group of companies that has outperformed since 2021, ended the first half of the year flat, while the S&P 493 ended up 15%. Across the board, large U.S. companies showed impressive earnings growth of 24% YTD, with revenues up 11%.
The market expansion to include a broader swath of large cap companies, small cap companies, and non-US companies may help assuage some market skeptics, but concerns about valuations remain. Many companies are still trading well above their historical valuations, and IPO-frenzy is everywhere. While earnings growth remains strong, especially for the AI hyperscalers, results from AI investments remain elusive. In all, equity markets continue to be the main driver of growth in the portfolio, but elevated levels require extra caution from investors.
The bond market saw a more muted quarter, as concerns about rising inflation introduced the possibility of a rate hike later this year. Bloomberg Global Agg ended the quarter down 0.2% YTD, while US Munis were up 1%. More broadly, the bond market is adapting to a new Fed chair who is seeking to end the practice of Forward Guidance and encourage investors to assess economic data directly. For bond investors, this could mean a bond market that is less predictable and requires more intentional choices around duration and credit quality.
The Outlook
With the Supreme Court invalidating broad tariffs, the idea of Tariff Rebate checks, previously floated as a pre-election boost to consumers, appears to be shelved. This likely means no additional fiscal stimulus this year. With the Fed now openly discussing a rate hike, which is also priced in by investors, it appears the U.S. economy will need to ride out the year powered by its own sails.
Uncertainty on this course abounds. The war in Iran, and especially tensions around the Strait of Hormuz, appear likely to flare up at any moment. Like so many global events, this latest round of conflict in the Middle East won’t end in a bang and instead will fizzle and morph into a new complicated reality. Still, the world economy has shown its ability to withstand significant oil shocks, even if its ability to do so again hangs on the speed with which national reserves can be refilled.
We can also expect a ramp up of political rhetoric as the midterm election nears. While the proposed agenda often bears little relation to the policies ultimately enacted, there are genuine populist trends that can have material impact on the economy and high-net-worth individuals that are likely to create uncertainty.
And finally, AI continues to loom large for individuals, companies, and our society at large. The promise is tempered by uncertainty over the future and nature of work. And while employees contemplate the demise of their skills, companies fret over the value of the tokens they are purchasing, the capture of their IP, and the return on their investment in AI. This calibration of a new technology carries risks, both to the financial system and to the economy, that investors should be cognizant of.
In all, the U.S. economy continues its slow but steady growth trajectory despite myriad speed bumps. Investors should be mindful of the risks facing the economy and the market and ensure their ability to ride out further turmoil from the Middle East, the upcoming election, and the evolution of AI. Importantly, this doesn’t mean divestment; it means stay invested, but intentionally.
Wishing us all a happy and peaceful summer.
— AMD