July 10, 2024 – A truism of US economics is that one should never underestimate the US consumer and their ability to propel the economy forward through spending. But what happens when consumers start running out of money? Fast-food chains are finding out. After years of raising prices and increasing profits, consumers appear to have reached a breaking point, and fast-food companies are starting to feel the pain. In Response, McDonald’s (embroiled in a social media dispute over an $18 hamburger), Burger King, Sonic, Taco Bell, and Starbucks have all loudly announced new value meals. Walmart, Target, and Amazon are right behind them in offering deep discounts. We have entered a period of value wars.
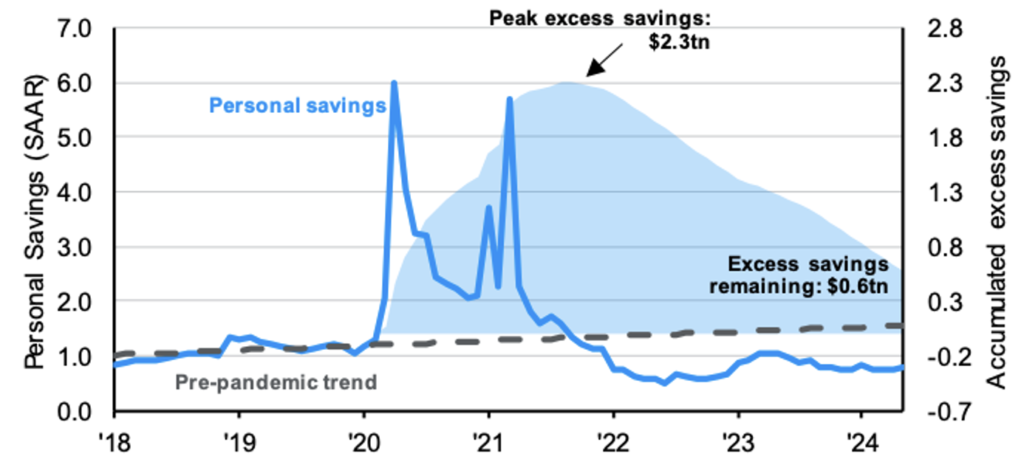
Retail is not the only place where consumer weakness is popping up. Delinquencies of auto and credit card loans have surpassed 2019 levels and are approaching levels not seen since 2010. Household savings have decreased to pre-pandemic levels, and the excess savings accumulated during the pandemic are all but gone (see Chart 1). With the current interest rates and banks tightening lending standards, consumers can’t count on new loans to provide cash, leaving them with only one option—reduce spending.
This change to consumers’ balance sheets comes as the labor market is showing definitive signs of slowing down. Unemployment figures released on July 5th show the US added only 206,000 jobs in June, a number most economists believe is consistent with a growth rate below 2%. These estimates are consistent with the Atlanta Fed GDPNow official estimate that puts Q2 economic growth at 2%, a sharp decrease from early quarter estimates of 4%.[1] The US economy is still growing, just not as fast as it had been. And an economy growing at 1-2% per year can more easily slip into economic contraction. There is less room for error, and the risk of falling into a recession increases.
Historically, monetary and fiscal stimulus are the tools policyholders use to stave off or at least minimize the impact of a recession. As we have discussed previously, the Fed might be slow to lower interest rates until it is confident there will not be a resurgence of inflation. The data on inflation is moving in the right direction, but whether that will be enough to move the Fed prior to growth grinding to a halt is an open question.
The prospect of fiscal stimulus is also murky. According to the Congressional Budget Office, the US is expected to run a deficit of 7% of GDP in 2024, a relatively high level considering we are not currently in a recession.[2] It is not clear how much larger lawmakers will allow the deficit to grow if the slowdown deepens.
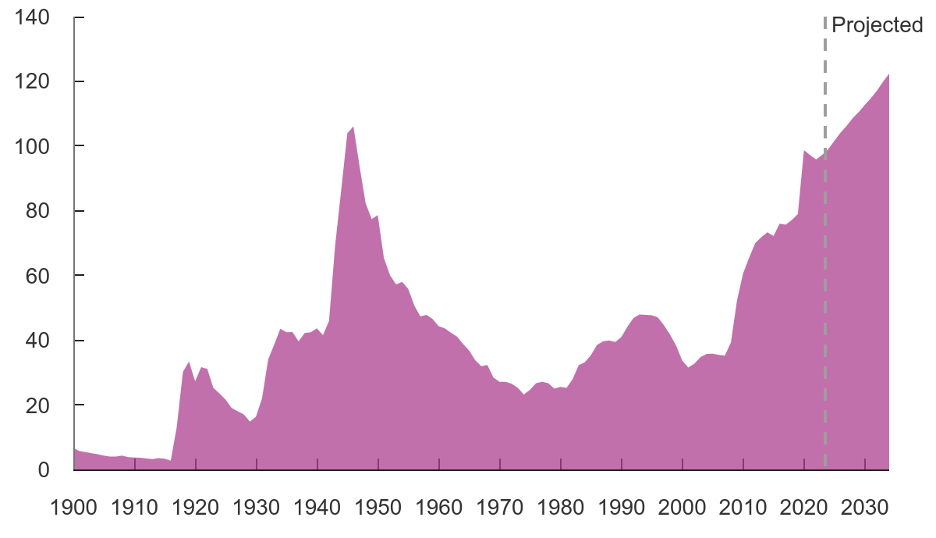
The larger challenge facing US government spending is the total national debt level (this is different than the deficit, which is how much the US adds/reduces to its debt each year). The CBO expects federal debt held by the public to reach 99% of GDP by the end of the year, its highest level since 1946. The debt level might not limit spending during the next recession—it would depend on what lawmakers and markets will allow for, but the need to halt and then reverse the trajectory of US government debt is likely to loom large over the economy in the coming years.
To cap this already transitional quarter, political uncertainty, both domestically and abroad, has reared its head earlier in the year than anyone expected. Domestically, the stated policies of both (current) candidates would do little to address any of the above issues. More tariffs and growing deficits—either through additional spending or by cutting taxes—would increase prices and increase the deficit, respectively. European countries, meanwhile, and especially France, are facing their own political reckoning in a highly polarized environment, leading to political gridlock that would make reacting to any economic turmoil more difficult.
The Markets
As the saying goes, Wall St. is not Main St. As the economy slows, the S&P 500 and tech-heavy NASDAQ ended the quarter just under record highs. However, the concentration of equity returns continued to increase, with the Magnificent 7 accounting for 61% of the S&P 500 returns in the first half of 2024.[3] While the S&P 500 returned 14.4% over this period, the S&P ex-Magnificent 7 returned a mere 5%. US small and midcap stocks, meanwhile, ended the period up 1% and 4.1%, respectively. Globally, the MSCI All World, our primary equity benchmark, was up 2.9% for the quarter.
Several factors seem to be driving the equity markets. The first is strong earnings, with earnings-per-share up 10.8% this year. For the Magnificent 7, earnings in the first quarter were up 50% year-over-year. The second factor is optimism around AI, which again is highly concentrated around the large tech companies. Finally, expectations that the Fed will cut interest rates later this year seem to be playing a key role in driving stocks up. This was most apparent in May, when data showing cooling inflation spiked the recent rally.
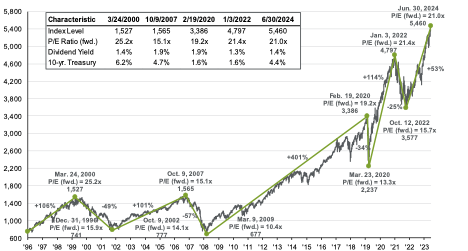
While valuations are undoubtedly high, they are closer to peak valuations of early 2020 and 2022 than they are to those of the Dot-com Bubble. Today’s price-to-earnings ratio of 21X is well above the 30-year average of 16.7X, suggesting that markets might struggle to continue growing at a blistering pace in the years ahead.
Bonds markets, meanwhile, continued to struggle as expectations of Fed rate cuts were challenged. The Fed itself, via its dot plot, now only projects one 0.25% rate cut by the end of the year. As a result, the US Barclay Agg, ended the quarter at 0.1% and remains down -0.7% year to date. The treasury yield curve also remains inverted, with various short-term rates higher than long-term rates, though it continues moving towards its more normal upward shaping slope.
The Outlook
We have been discussing the prospect of the US economy slowing down since the Fed started raising rates almost two years ago. Now, it finally seems to be happening. As the data keeps rolling in, we expect to see increasing signs of slowing, and the big question is how long will the Fed wait to cut rates. This decision could be a big contributor to the depth of the next recession and will likely shape the direction of the bond market in the years ahead.
The fate of fiscal stimulus, as well as the growing federal debt problem, will need to be addressed by the next administration. We expect politics to dominate headlines for much of the remainder of 2024. As always, we will attempt to cut through the noise and distill the economic impact of the different candidates’ expected policies as they emerge. The coming election promises to be a period of emotional turmoil, and we expect that to add to the volatility in the markets.
Finally, geo-political and national events around the world remain top of mind for many. Though headlines remain scary, there have been mild signs of a cooling in various arenas. The election in Iran following the unexpected death of Ibrahim Raisi in a helicopter crash yielded a “token reformist.” Negotiations for a cease fire in Gaza appear to have picked up. And high-level bilateral meetings in April, including a phone call between Presidents Biden and Xi, and a visit to China by Treasury Secretary Janet Yellen and Secretary of State Antony Blinken, signal a desire to increase dialogue between these two world powers. The Ukraine war appears to have ground to a halt, and much now hangs on US policy following the US election.
With continued hope for more peaceful days ahead. Wishing you all a happy and cooler summer!
— AMD
[1] https://www.atlantafed.org/cqer/research/gdpnow on 7/9/2024
[2] https://www.cbo.gov/publication/60039
[3] Sources for market data: Robertson Stephens Investment Office, JP Morgan Guide to the Markets
Disclosures
Investment advisory services offered through Robertson Stephens Wealth Management, LLC (“Robertson Stephens”), an SEC-registered investment advisor. Registration does not imply any specific level of skill or training and does not constitute an endorsement of the firm by the Commission. This material is for general informational purposes only and should not be construed as investment, tax or legal advice. It does not constitute a recommendation or offer to buy or sell any security, has not been tailored to the needs of any specific investor, and should not provide the basis for any investment decision. Please consult with your Advisor prior to making any Investment decisions. The information contained herein was carefully compiled from sources believed to be reliable, but Robertson Stephens cannot guarantee its accuracy or completeness. Information, views and opinions are current as of the date of this presentation, are based on the information available at the time, and are subject to change based on market and other conditions. Robertson Stephens assumes no duty to update this information. Unless otherwise noted, any individual opinions presented are those of the author and not necessarily those of Robertson Stephens. Indices are unmanaged and reflect the reinvestment of all income or dividends but do not reflect the deduction of any fees or expenses which would reduce returns. Past performance does not guarantee future results. Forward-looking performance targets or estimates are not guaranteed and may not be achieved. Investing entails risks, including possible loss of principal. Alternative investments are only available to qualified investors and are not suitable for all investors. Alternative investments include risks such as illiquidity, long time horizons, reduced transparency, and significant loss of principal. This material is an investment advisory publication intended for investment advisory clients and prospective clients only. Robertson Stephens only transacts business in states in which it is properly registered or is excluded or exempted from registration. A copy of Robertson Stephens’ current written disclosure brochure filed with the SEC which discusses, among other things, Robertson Stephens’ business practices, services and fees, is available through the SEC’s website at: www.adviserinfo.sec.gov. © 2024 Robertson Stephens Wealth Management, LLC. All rights reserved. Robertson Stephens is a registered trademark of Robertson Stephens Wealth Management, LLC in the United States and elsewhere.