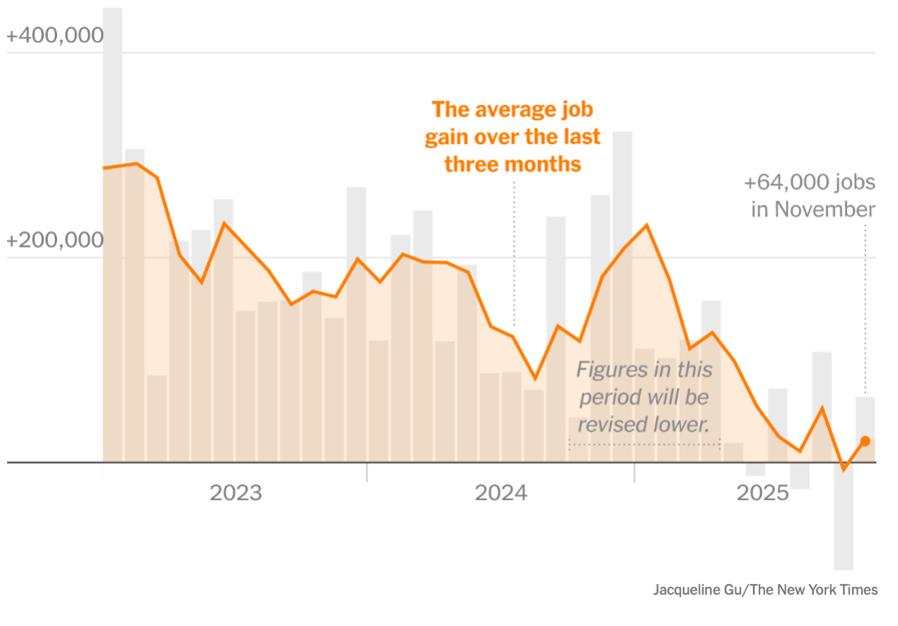
The long-delayed, much-awaited report on November US employment showed 64,000 jobs created, a number that most observers expect to be revised downward in the coming months. The erratic nature of the monthly jobs reports and the tendency towards significant revisions have encouraged various ways of looking for the trendline, including the 3-month rolling average method shown in this chart. It is this slow erosion of the strong employment market in 2023 and 2024 that has politicians, policy-makers, and the average US household so concerned, with the exclamation point provided by an unemployment rate that rose to 4.6%, from 4.4% in September.
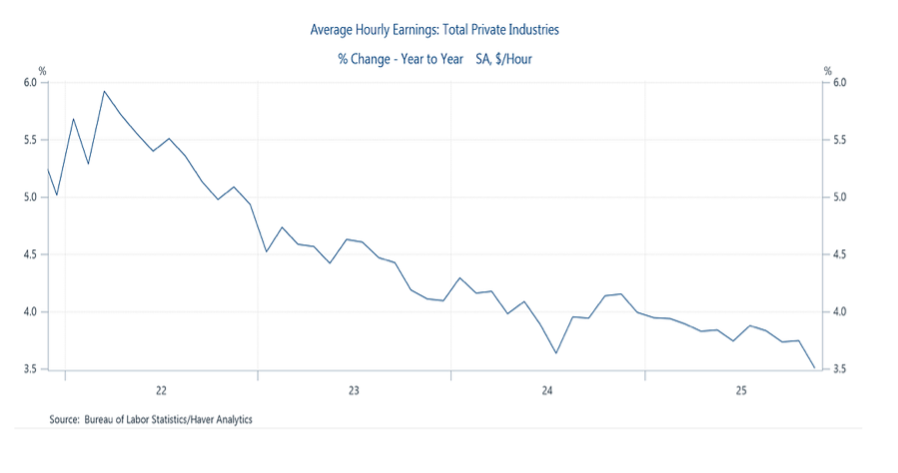
Accompanying the November employment report was a sobering report on labor earnings. Although the 3.5% growth in average hourly earnings remained well ahead of the overall rise in prices (as measured by the Consumer Price Index), here, too, it is the downward trendline that garnered the most attention. It should be noted, when considering the hourly compensation figures, that the employment report also showed a sharp jump in the “underemployment” figure; the number of people stating that they were not working as much as they would like. Underemployment often rises when job opportunities drop, and there is an unmet need for more income to cover rising expenses.
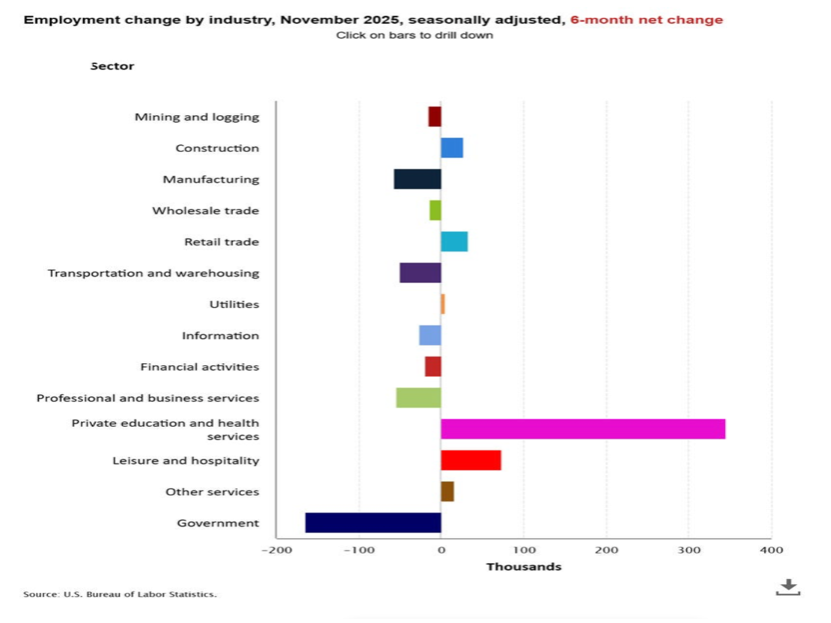
Government employment fell substantially in November as deferred resignations among federal employees took effect. Some portion of the 168,000 government jobs lost were a result of the government shutdown, but the vast majority of federal employees who were furloughed were kept on the payroll. Manufacturing and trade-sensitive transportation and warehousing also posted noteworthy declines, but the reduction in jobs in the professional and business services category is the real attention-getter. In the US, professional and business services typically deliver solid job growth when the economy is expanding, or at least stability during periods of slowing economic activity.
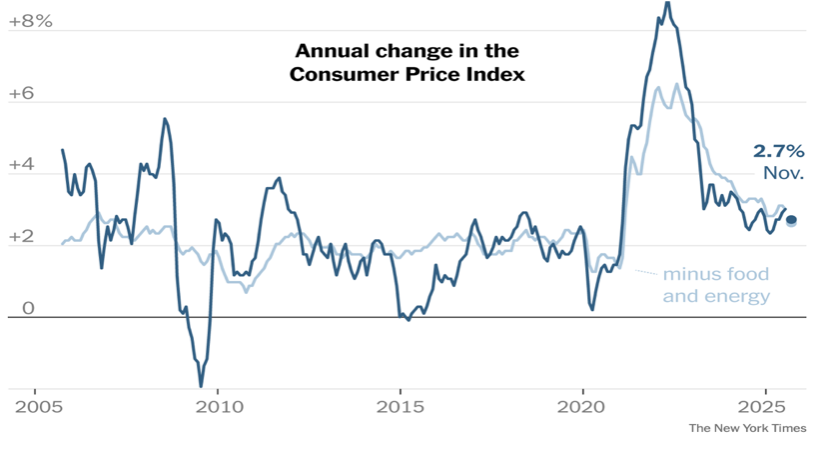
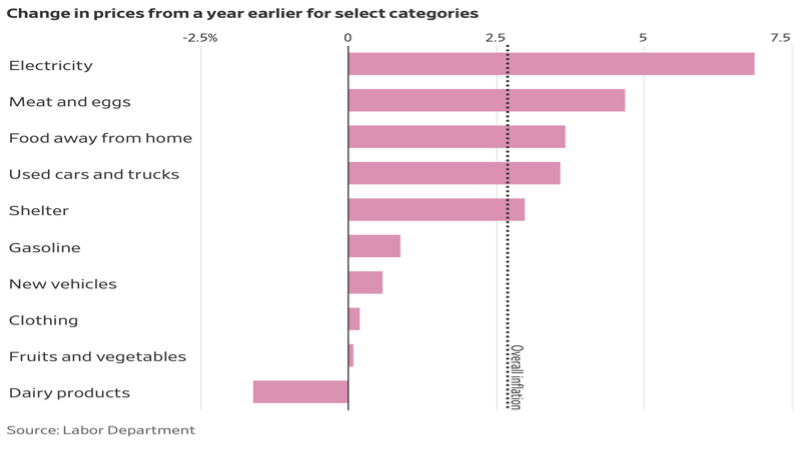
Questions about the accuracy of the data collection and reporting run by the Bureau of Labor Statistics have been increasing for years. The Bureau has been chronically understaffed and underfunded, and updated methodologies have been difficult to approve, let alone implement. Most of the criticism, however, has been levelled at the employment report, not the Consumer Price Index (CPI)—until this week. Unusual and implausible decelerating inflation in key consumer spending categories such as health care and shelter has led to widespread attribution of the 2.6% November “Core” CPI (the lowest core CPI in four years) to poor data and sloppy technique. It is speculated that data was collected only during the second half of November, when “Black Friday” sales promotions were abundant, and that the notoriously challenging work of calculating imputed rent (the monthly cost of shelter) was simply not completed. The November CPI is probably not wildly inaccurate in its depiction of an overall easing of inflationary pressures, but it stands in sharp contrast to the messaging on prices received from the Federal Reserve’s so-called “Beige Book” report on regional economic conditions, released on November 26, 2025. Because of the permanent absence of October data due to the government shutdown, it may take several additional months to more accurately measure US inflation and assess the proper direction of monetary policy.