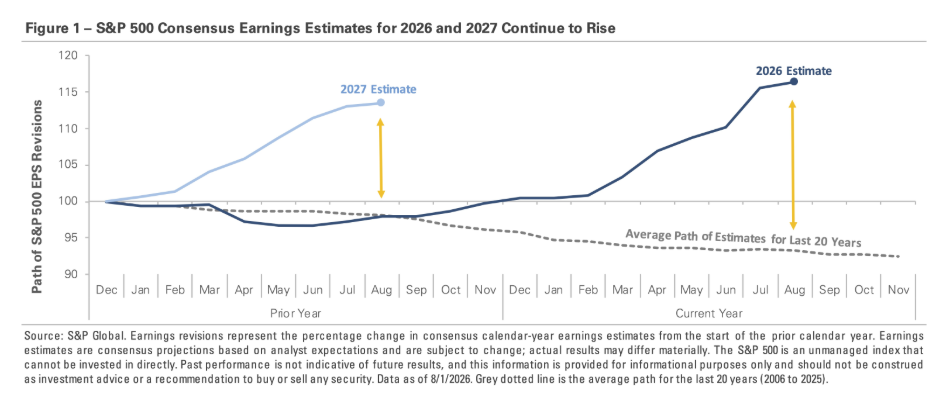
The S&P 500’s forward P/E multiple has compressed from roughly 22x–23x in January 2026 down to approximately 20x–21x due to strong corporate earnings growth outpacing stock price gains. Each year tends to follow a similar script on Wall Street. Analysts start the year optimistic about how much profit companies will earn, then spend the following quarters trimming those forecasts as actual results come in. Figure 1, which tracks the S&P 500 earnings estimates for each calendar year over the prior two years, shows the pattern. As an example, analysts would start tracking 2026 earnings estimates at the start of 2025, two years ahead of time. For comparison purposes, the starting point for each year is set to 100. The gray dashed line shows the average path over the last 20 years. It slopes steadily down and ends about -8% below where it began, highlighting how analysts often revise their estimates to match results and corporate guidance. In contrast, the two darker lines, which graph the estimates for 2026 and 2027, are doing the opposite. Both have risen more than +10% since tracking began. Analysts are raising their estimates this cycle, not cutting, which stands out against two decades of history.
This year is different because actual earnings results have been strong. Analysts have consistently raised their estimates to keep pace with what companies are reporting, with profits repeatedly coming in ahead of expectations. The S&P 500 is on track for its seventh straight quarter of double-digit earnings growth. The technology sector is a major contributor, as heavy investment in artificial intelligence produces sales and earnings growth, but the strength reaches beyond it as well. More than 85% of S&P 500 companies have beaten their Q2 earnings estimates, above the five-year average of 78%. The strength is even more notable given the backdrop, which includes the Middle East conflict, volatile oil prices, and lingering inflation.
The stock market’s strong returns in recent years have been powered by real earnings growth, not just investor enthusiasm. The chart shows that analysts expect the strength to continue, with forecasts calling for another year of double-digit earnings growth in 2027. Much of the outlook rests on the AI buildout, where the largest tech companies are expected to continue spending heavily on infrastructure. Analysts also point to the wider economy, with expectations for steady economic growth and a productivity boost as more companies implement AI in their operations. However, none of this guarantees a smooth ride. When expectations run this far above normal, they set a high bar. Companies now have to deliver on forecasts that already assume a lot of good news. Volatility along the way is almost certain, but it’s the price of admission for the returns stocks provide. For long-term investors, the point is simple: prices follow earnings, not headlines.