

They say fashion trends are rarely new and mostly repeat themselves. Walk around Brooklyn, where I live, and you’ll see plenty of mullets, straight-leg jeans, and baby tees harking back to the late 90s and early aughts. Well, fashion is not the only Y2K throwback of the season; please welcome back the pre-2008 interest rates! (round of applause)
To fully appreciate the magnitude of the change in the interest rate environment, it’s worth reflecting on just how abnormally low interest rates were between the Global Financial Crisis (GFC) of 2008 and 2022, when the 10-year Treasury crossed the 4% yield for the first time since 2010.[1] This was the era of cheap money, and it touched almost every aspect of our lives: assets from stocks to real estate rallied with little connection to their fundamentals; companies like Uber, Lyft, DoorDash and WeWork subsidized consumers’ daily lives while burning through cheap venture capital and private equity money; and asset bubbles were created everywhere, from meme-coins through SPACs to companies that raised billions with no real business model.
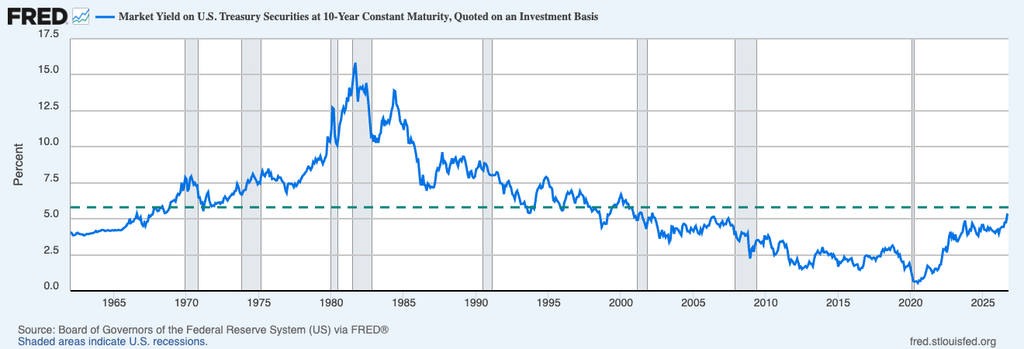
These past few weeks have shown definitively that we are no longer living in this era. And while rates have been elevated since peak 9% inflation in 2022, it’s only recently that the 10-year Treasury passed the 5% mark, breaking the 19-year ceiling set in June 2007.[2] Over the past 64 years, the average 10-year rate is 5.8%, meaning, after a 20-year detour, we’re almost back to average (Chart 1).[3]
Much has been and will be written about why interest rates are going up: rising government debt both domestically and abroad, strong economic growth, persistent energy-driven inflation driving interest rate hikes, the high level of debt issuance needed to fund the AI boom, and changes in the Treasury buying pool. But underlying many of these is the belief that the Fed is no longer putting its thumb on the scale to hold down long-term rates. In essence, the longer end of the yield curve has been at least partially set free, and while it still reflects the Fed’s short-term policy decisions, it is also reflecting investor views of the macro environment in a more accurate way than it has for a long time. It’s fair to assume that puts a smile on Chairman Warsh’s face, at least until he gets an angry phone call from the White House.
Higher interest rates will reverberate through the economy, raising borrowing costs for consumers, companies, and governments. However, they are also an opportunity for investors, especially those who need lower-risk assets like retirees, to earn a more competitive return without taking on equity risk. Notably, higher rates may add pressure on governments to deal with their ballooning sovereign debt issue. Here’s to hoping.
The Mighty U.S. Consumer Meets the AI Spending Boom
Out in the real world, higher interest rates have done nothing to deter the two main growth engines of the 2026 economy: the consumer, who, despite claiming a historically low level of confidence in the economy, keeps on spending, and the companies spending big on AI, all along the value chain. The economy grew north of 2% in the first half of 2026,[4] and Q3 is expected to continue this trend.
While unemployment has stayed low throughout the year, the labor market appears to be frozen more than it is robust. Few employees are quitting or getting fired as uncertainty around AI continues to complicate decision-making. After revisions, the economy added an average of 51,000 jobs a month in the last quarter,[5] which, with lower immigration and productivity growth, appears consistent with 2–2.5% growth in GDP.
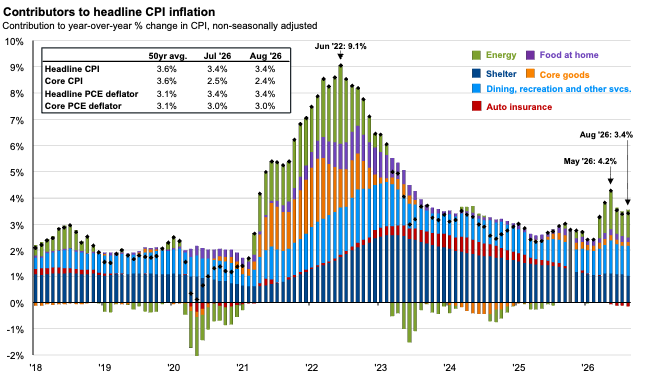
The lack of mobility in the labor market has supported the Fed’s continued fight against inflation, even while oil prices drove the Fed to raise rates in September for the first time since 2023.[6] In all, the inflation trend appears positive, and core inflation (excluding food and energy prices) declined in August to 2.4% (Chart 2).[7]
Despite multiple headwinds, the U.S. economy continues its forward momentum carried by formidable consumer spending and massive AI investment. Risks remain abundant, but so does the belief in the future so crucial to economic growth.
Corporate Earnings Carry the Day, but for How Long?
In the endless debate about the existence of an AI bubble, corporate earnings have been a shining light. Earnings are expected to grow 32% this year, dwarfing the growth of 10% and 13% in 2024 and 2025, respectively.[8] This growth has helped reduce the forward price-to-earnings ratio (P/E) of stocks to 19X as of September 30, even as the S&P 500 crested new highs. At 19X, the P/E ratio remains well above the 30-year average of 17.2X, but below recent highs.[9]
Noticeably, much of this earnings growth remains concentrated in the hands of a handful of AI companies, and the durability of these earnings, priced by the market as permanent, is open to debate. This is where the crux of the AI bubble debate really is—what will be the return on AI investment, and will it drive continued spending or generate profits elsewhere in the market? Importantly, is the return high enough, and will it come soon enough, for investments to make sense in a high-rate environment?
The answer to this debate, of course, is that we don’t know. Inflated stock market valuations can burst, and be seen in retrospect as a bubble, or earnings and cashflow could catch up, making valuations more reasonable again. The concentration of returns in the markets leaves room for many companies who have not seen a share-price rally to catch up, but also subjects the markets to vulnerability should AI earnings dwindle. If you know the answer to all these questions, please let me know. In the meantime, we choose to stay invested, but with a high level of intentionality to make sure we can ride out whatever the markets throw our way.
Who’s Ready for an Election?
Of all the macro events and secular trends that promise to shape the economy in Q4, none loom larger than the U.S. midterm election. Current forecasts heavily favor the Democrats to win the House, albeit by a narrow majority, and a Democratic Senate is possible, if less likely. Either way, it’s likely we will see a divided government, complicating the path to future fiscal stimulus and the Administration’s ability to tackle large issues such as AI regulation or the deficit.
The passing of the election could also mean a resumption of the war with Iran, which in turn could drive up oil prices, just as oil exports begin to near pre-war levels. Alongside the loss of life, fresh fighting would pose another challenge to global economies already struggling with high fuel prices, and especially diesel.
Finally, much of the economic and financial outlook will depend on the continued progress of AI, its implementation, and how views around AI risks evolve. As the WSJ headline put it a few weeks back, The AI Build-Out Is Becoming the Biggest Economic Bet in U.S. History. While the overall bet is out of our hands, investors also face a choice—participate cautiously, go all in, or wait on the sidelines. We choose the first—bring your straight-leg jeans, skip the mullet—but the ride might still be bumpy.
Wishing everyone a cozy and peaceful fall and a holiday season full of warmth and love.
— AMD